What can we help you with today?
Get help straight from the team at Well Data Labs...
Depth Variance: Multi-Well Analysis - Report Overview
Reports/Data Analytical Tools
Depth Variance: Multi-Well Analysis - Report Overview
Updated 2 weeks ago
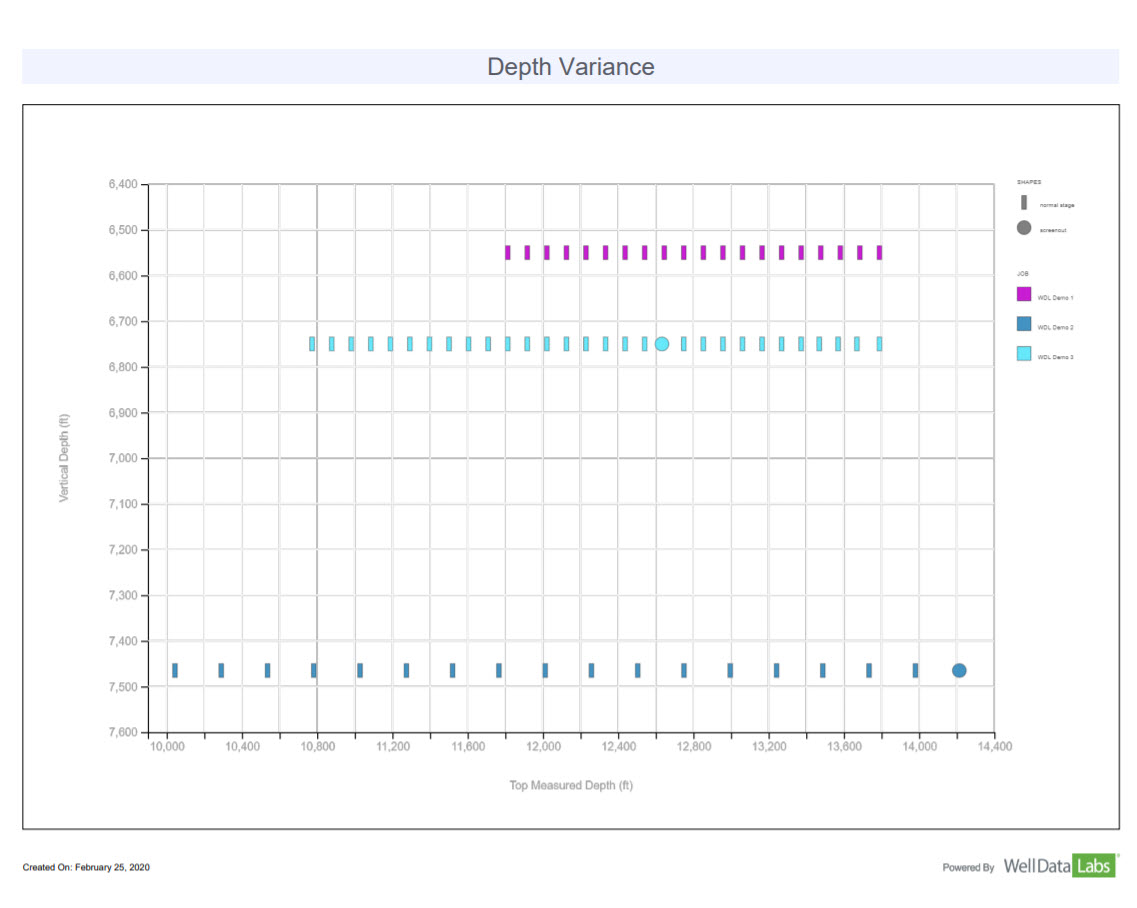
With the Depth Variance report, you can easily compare the depth or formation of your stages for your wells.
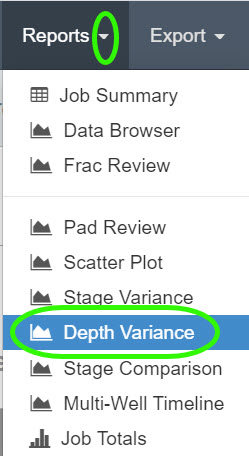
The report can be accessed by selecting Depth Variance from the Reports drop-down.
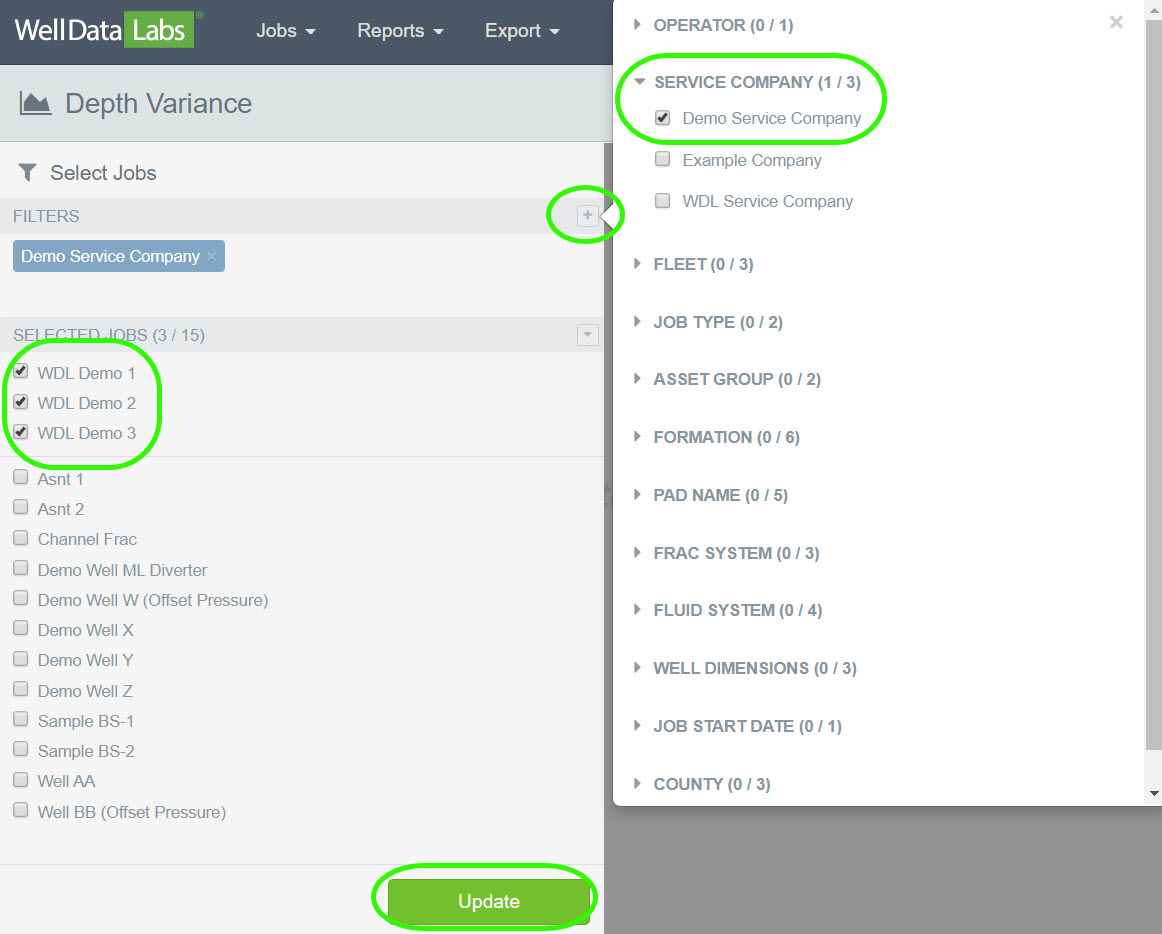
When the Depth Variance page opens, the filters section lets you quickly narrow down the list of elements and wells you would like to see on your chart. In this example, we are filtering the wells by Service Company and are selecting “Demo Service Company”. Then, selecting from a list of Jobs that are mapped to Demo Service Company. I.E. WDL Demo 1, 2 and 3. Click the Update button when you are finished.
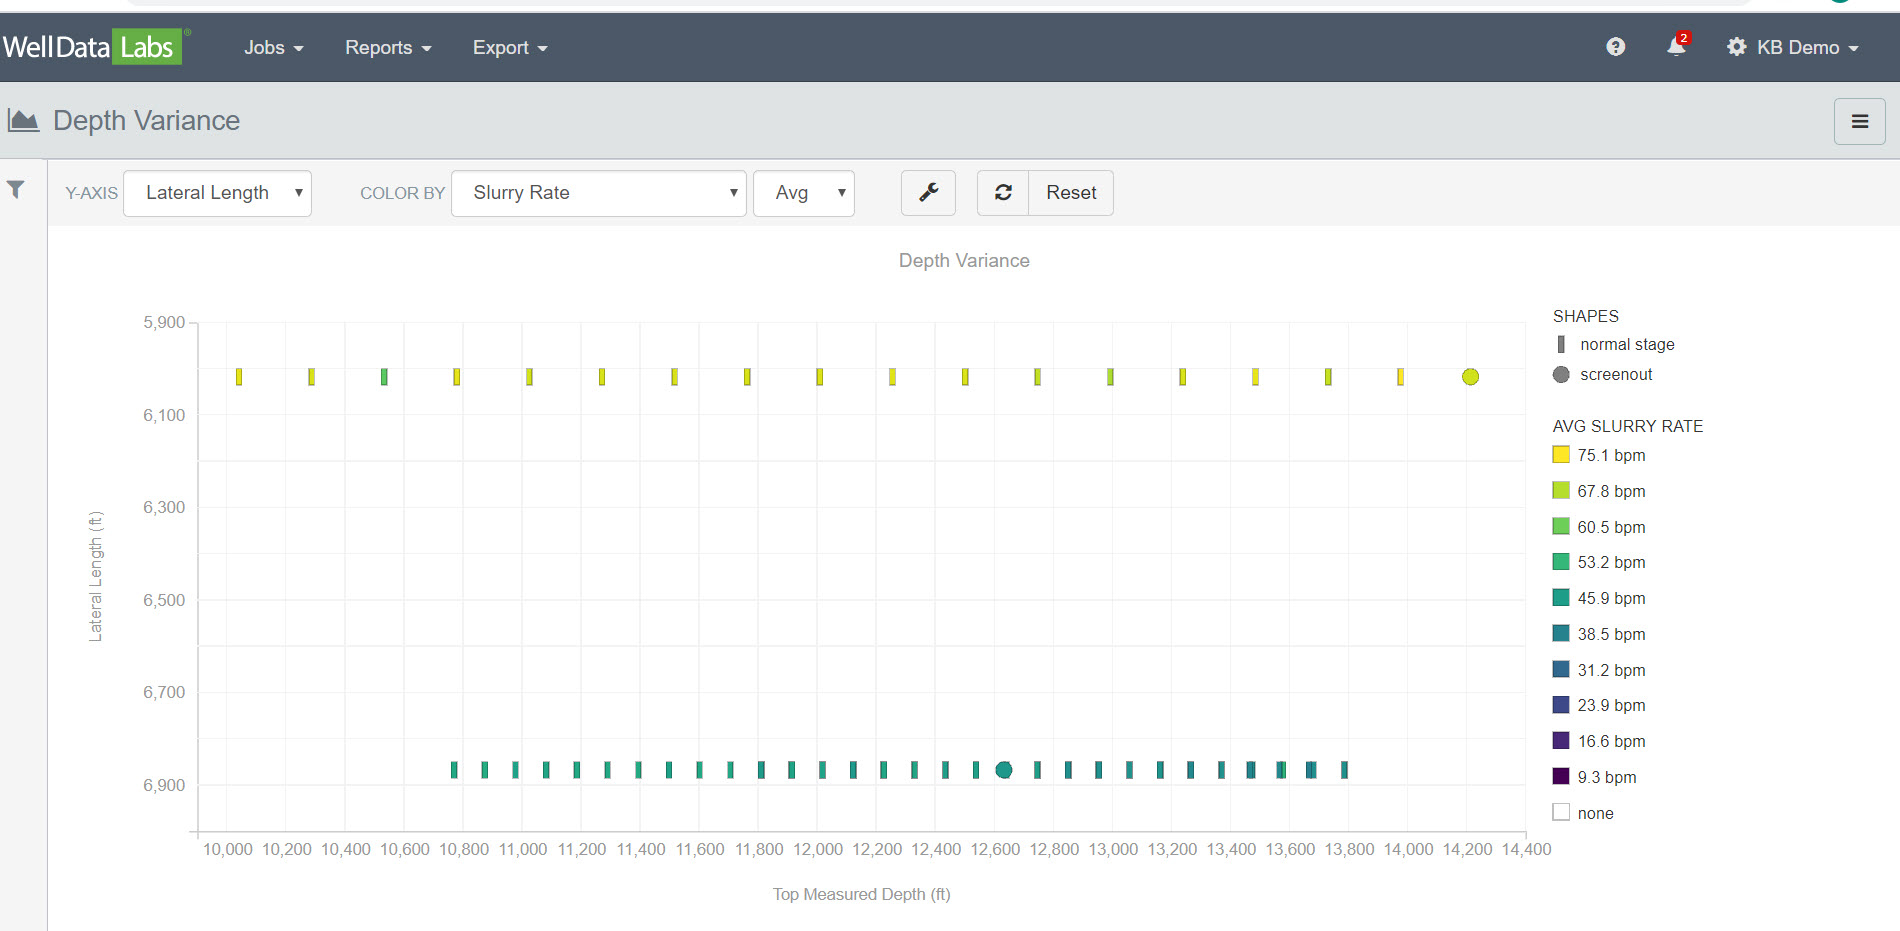
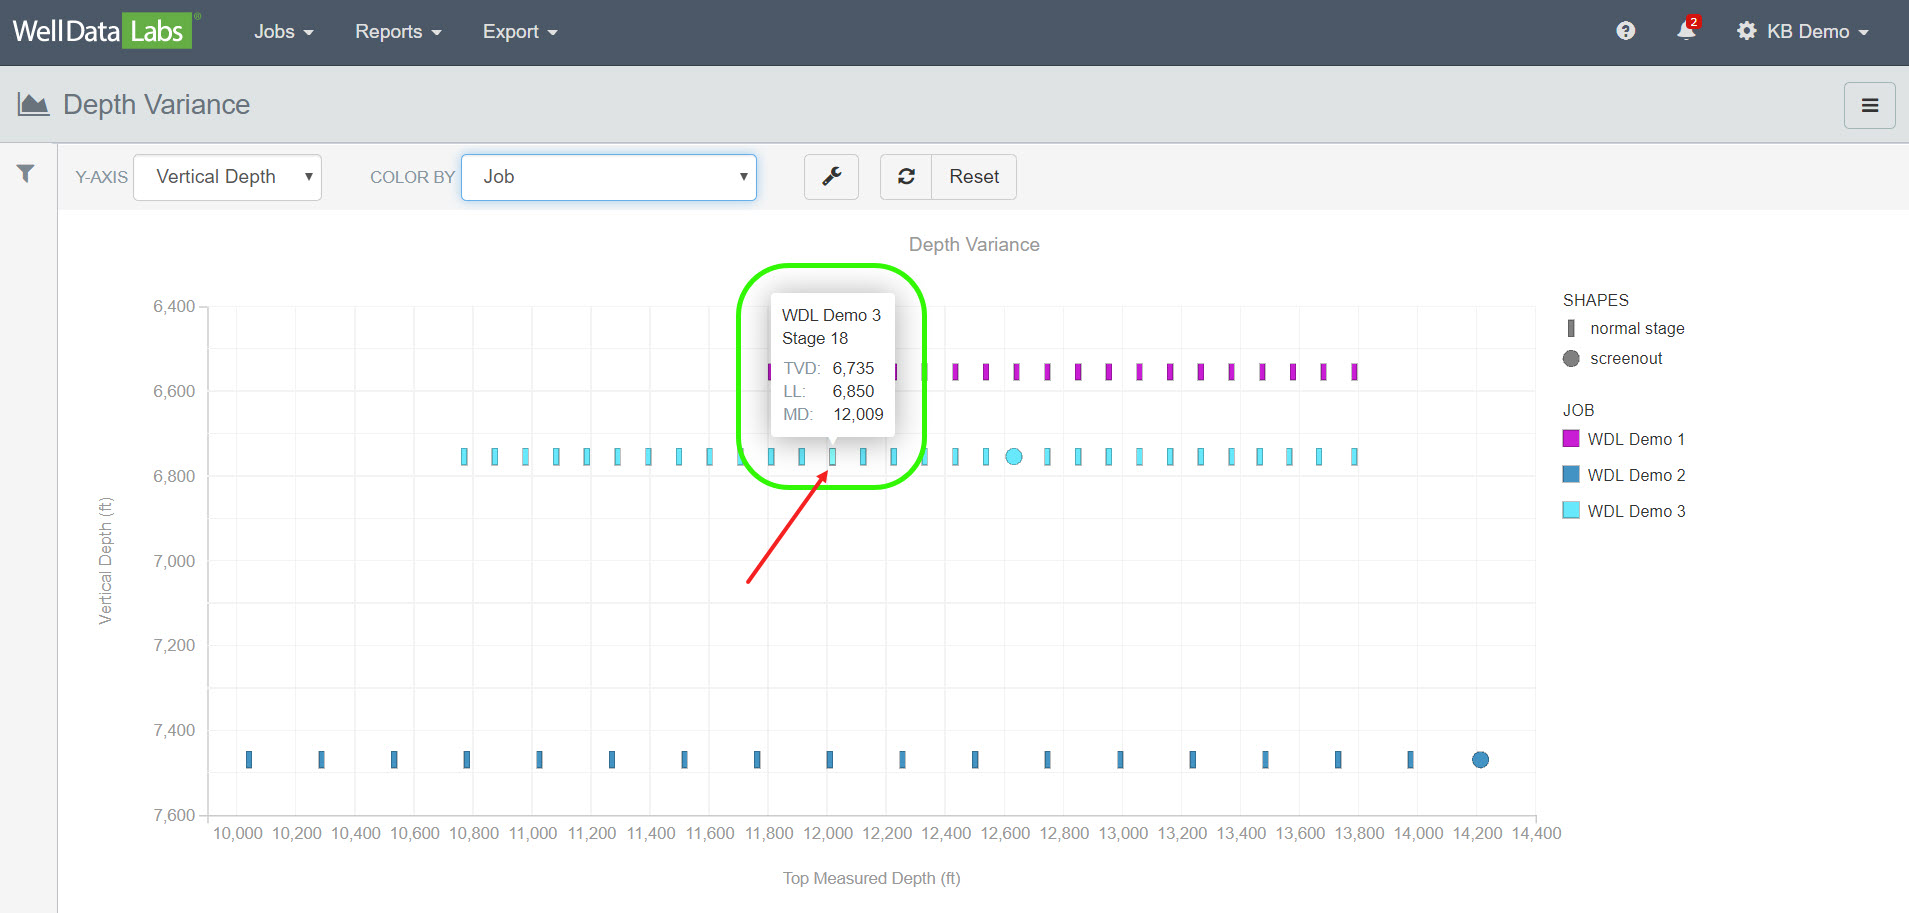
The Depth Variance report displays the Vertical Depth or Lateral Length by which element is selected in the "Color By" drop-down. In this example, we have selected the Y-Axis "Vertical Depth" by "Job".
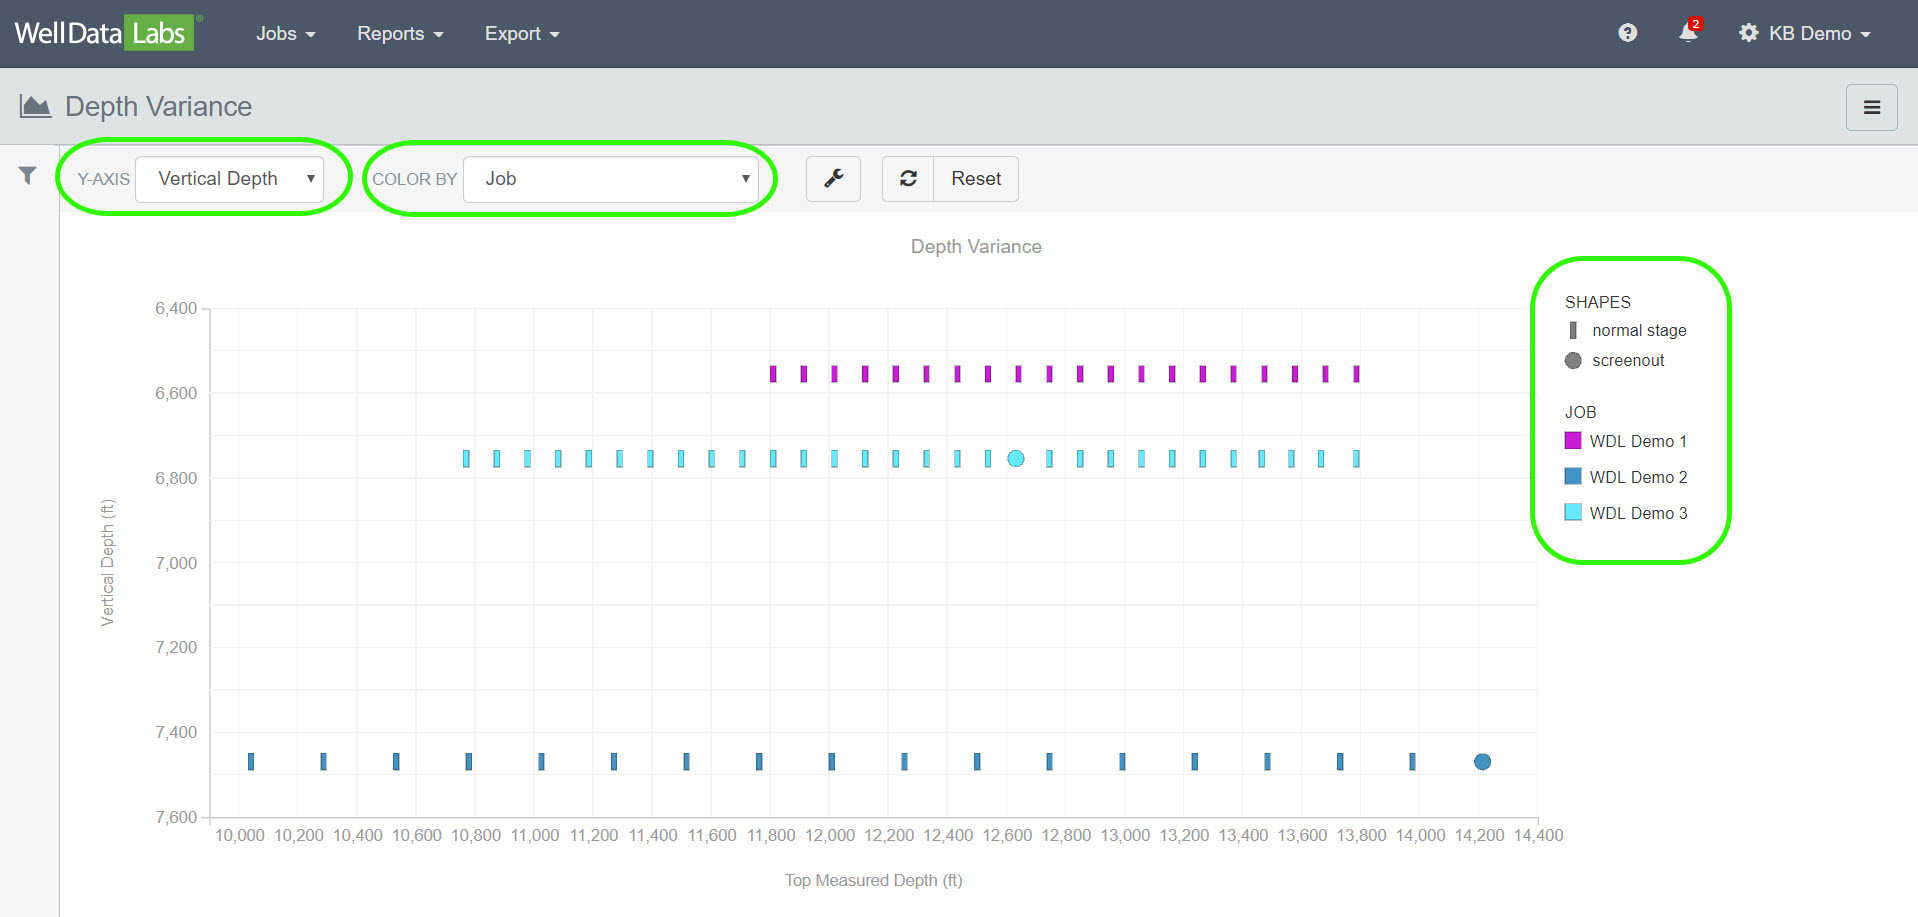
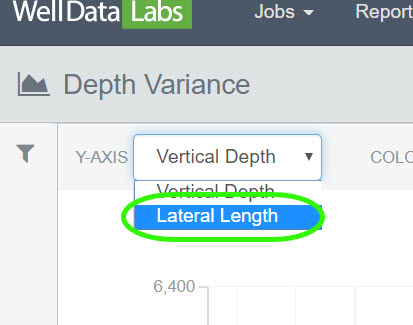
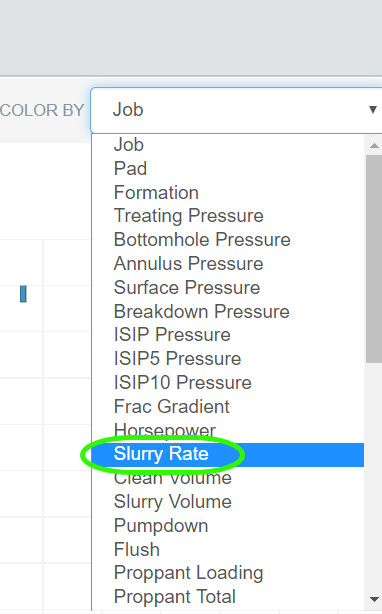
You can easily change the Y-Axis and Color By in your chart by making a selection from the drop-down lists.
View information by each stage by hovering your mouse over each stage.
Clicking on a stage on the chart will take you directly to that stage in the Job Summary.
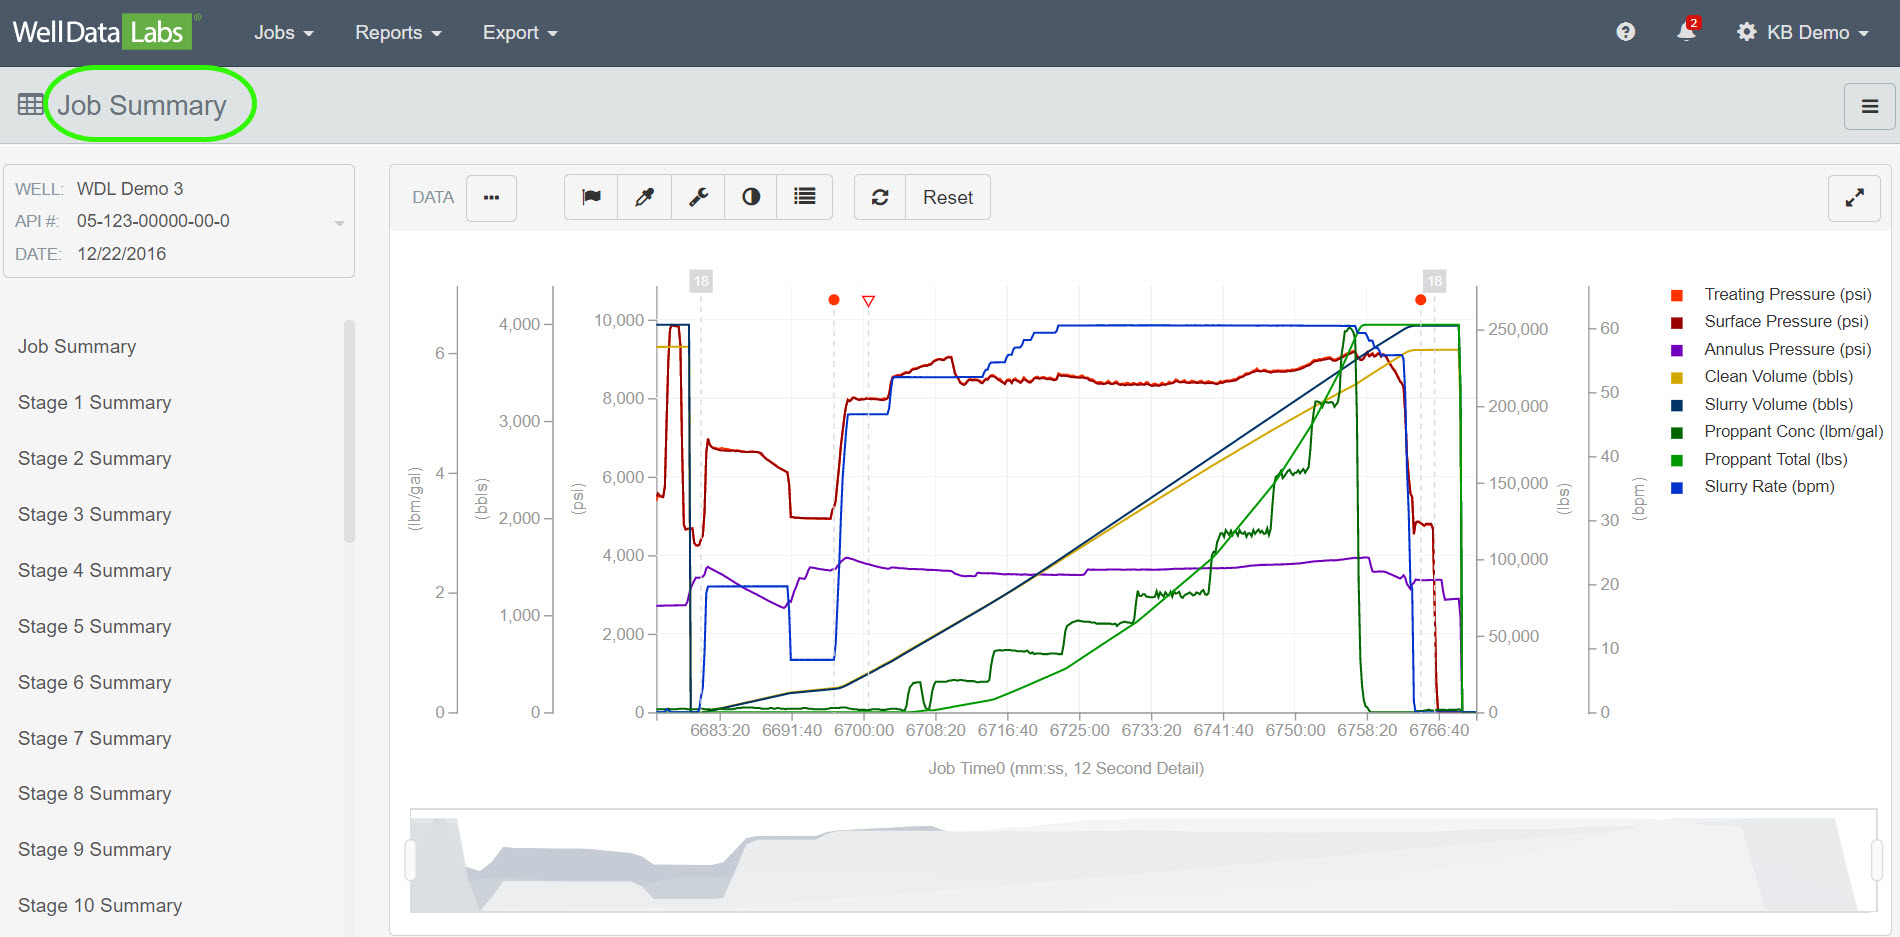
Click the back button on your browser to return to the Depth Variance report.
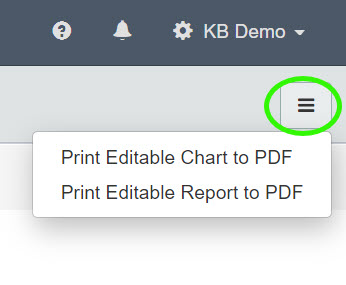
Print Editable Chart and/or Report to PDF:
You can easily print an editable Chart or Report to a PDF file by clicking on the 3-bar button in the upper right-hand corner of each page and making a selection.
We have a lot of great reports in Well Data Labs! If you would like to learn more about them, click on the Data Analytical Tools link. As always, if you need help or have any questions, please contact us at welldatalabs.com/support.