The Pad Review Report is a great tool if you would like to do pad-level analysis. You’ll be able to take a look at your pump time by day, daily and cumulative stages, see how your pad is progressing by completed stages and, see a grid with stats about your pad and the wells on it.
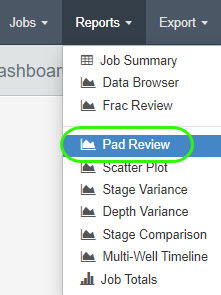
To access the Pad Review, click the Reports drop-down on the toolbar and select Pad Review.
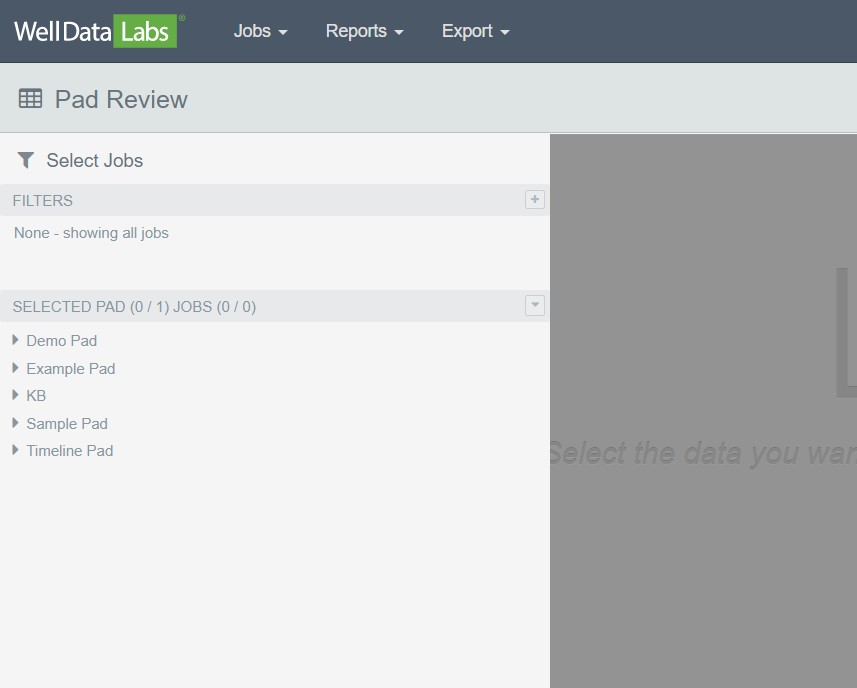
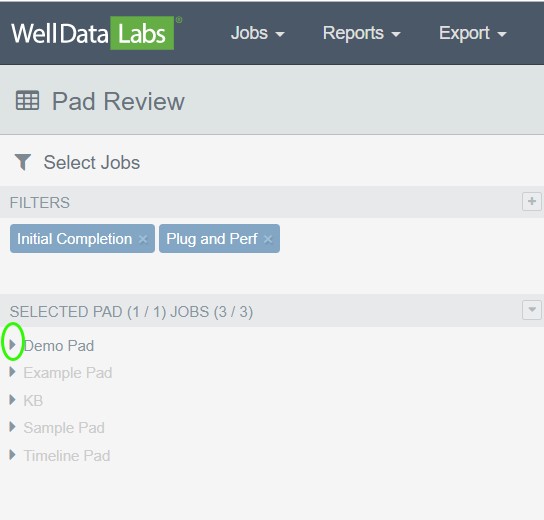
When the Pad Review window opens, you will be able to filter the Pads that you would like to take a look at.
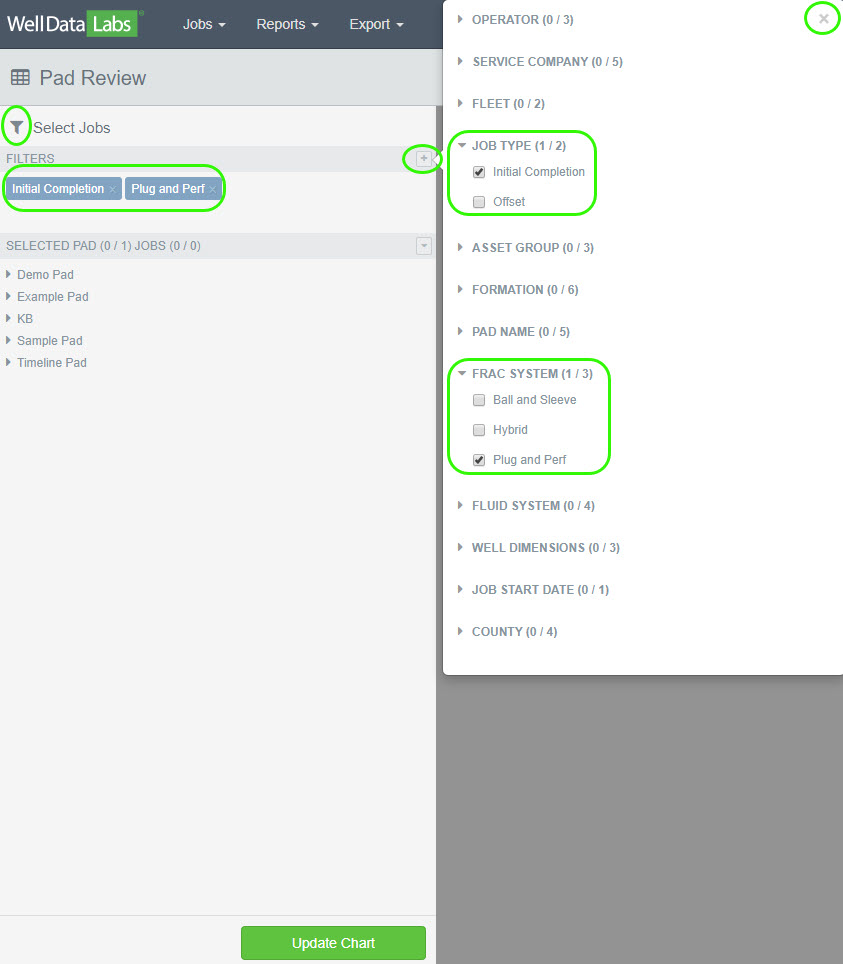
Begin by building out a Filter set to narrow down the list of Pads to select from. Click the plus sign next to Filters, then click the arrow to expand the available criteria for each element. As you select filters, you'll see the Selected Pad list change to contain only those Pads that match any of the filters you have selected. When you've completed selecting the filters you want, click the "X" to hide the window. Your selected filters will be shown as blue boxes.
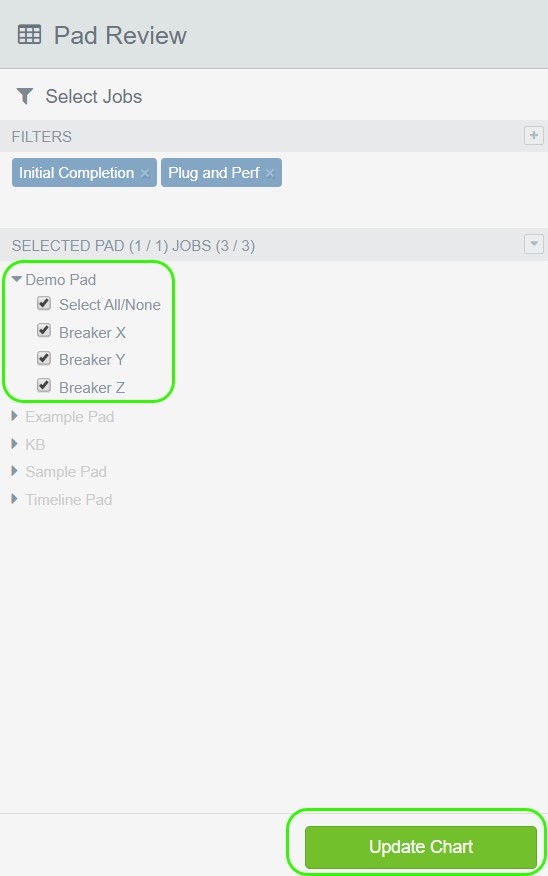
Once you have selected your Filters, choose the Jobs that you would like to see by clicking the arrow next to the Pad name to expand the Job list, and select those Jobs. Click Update Chart.
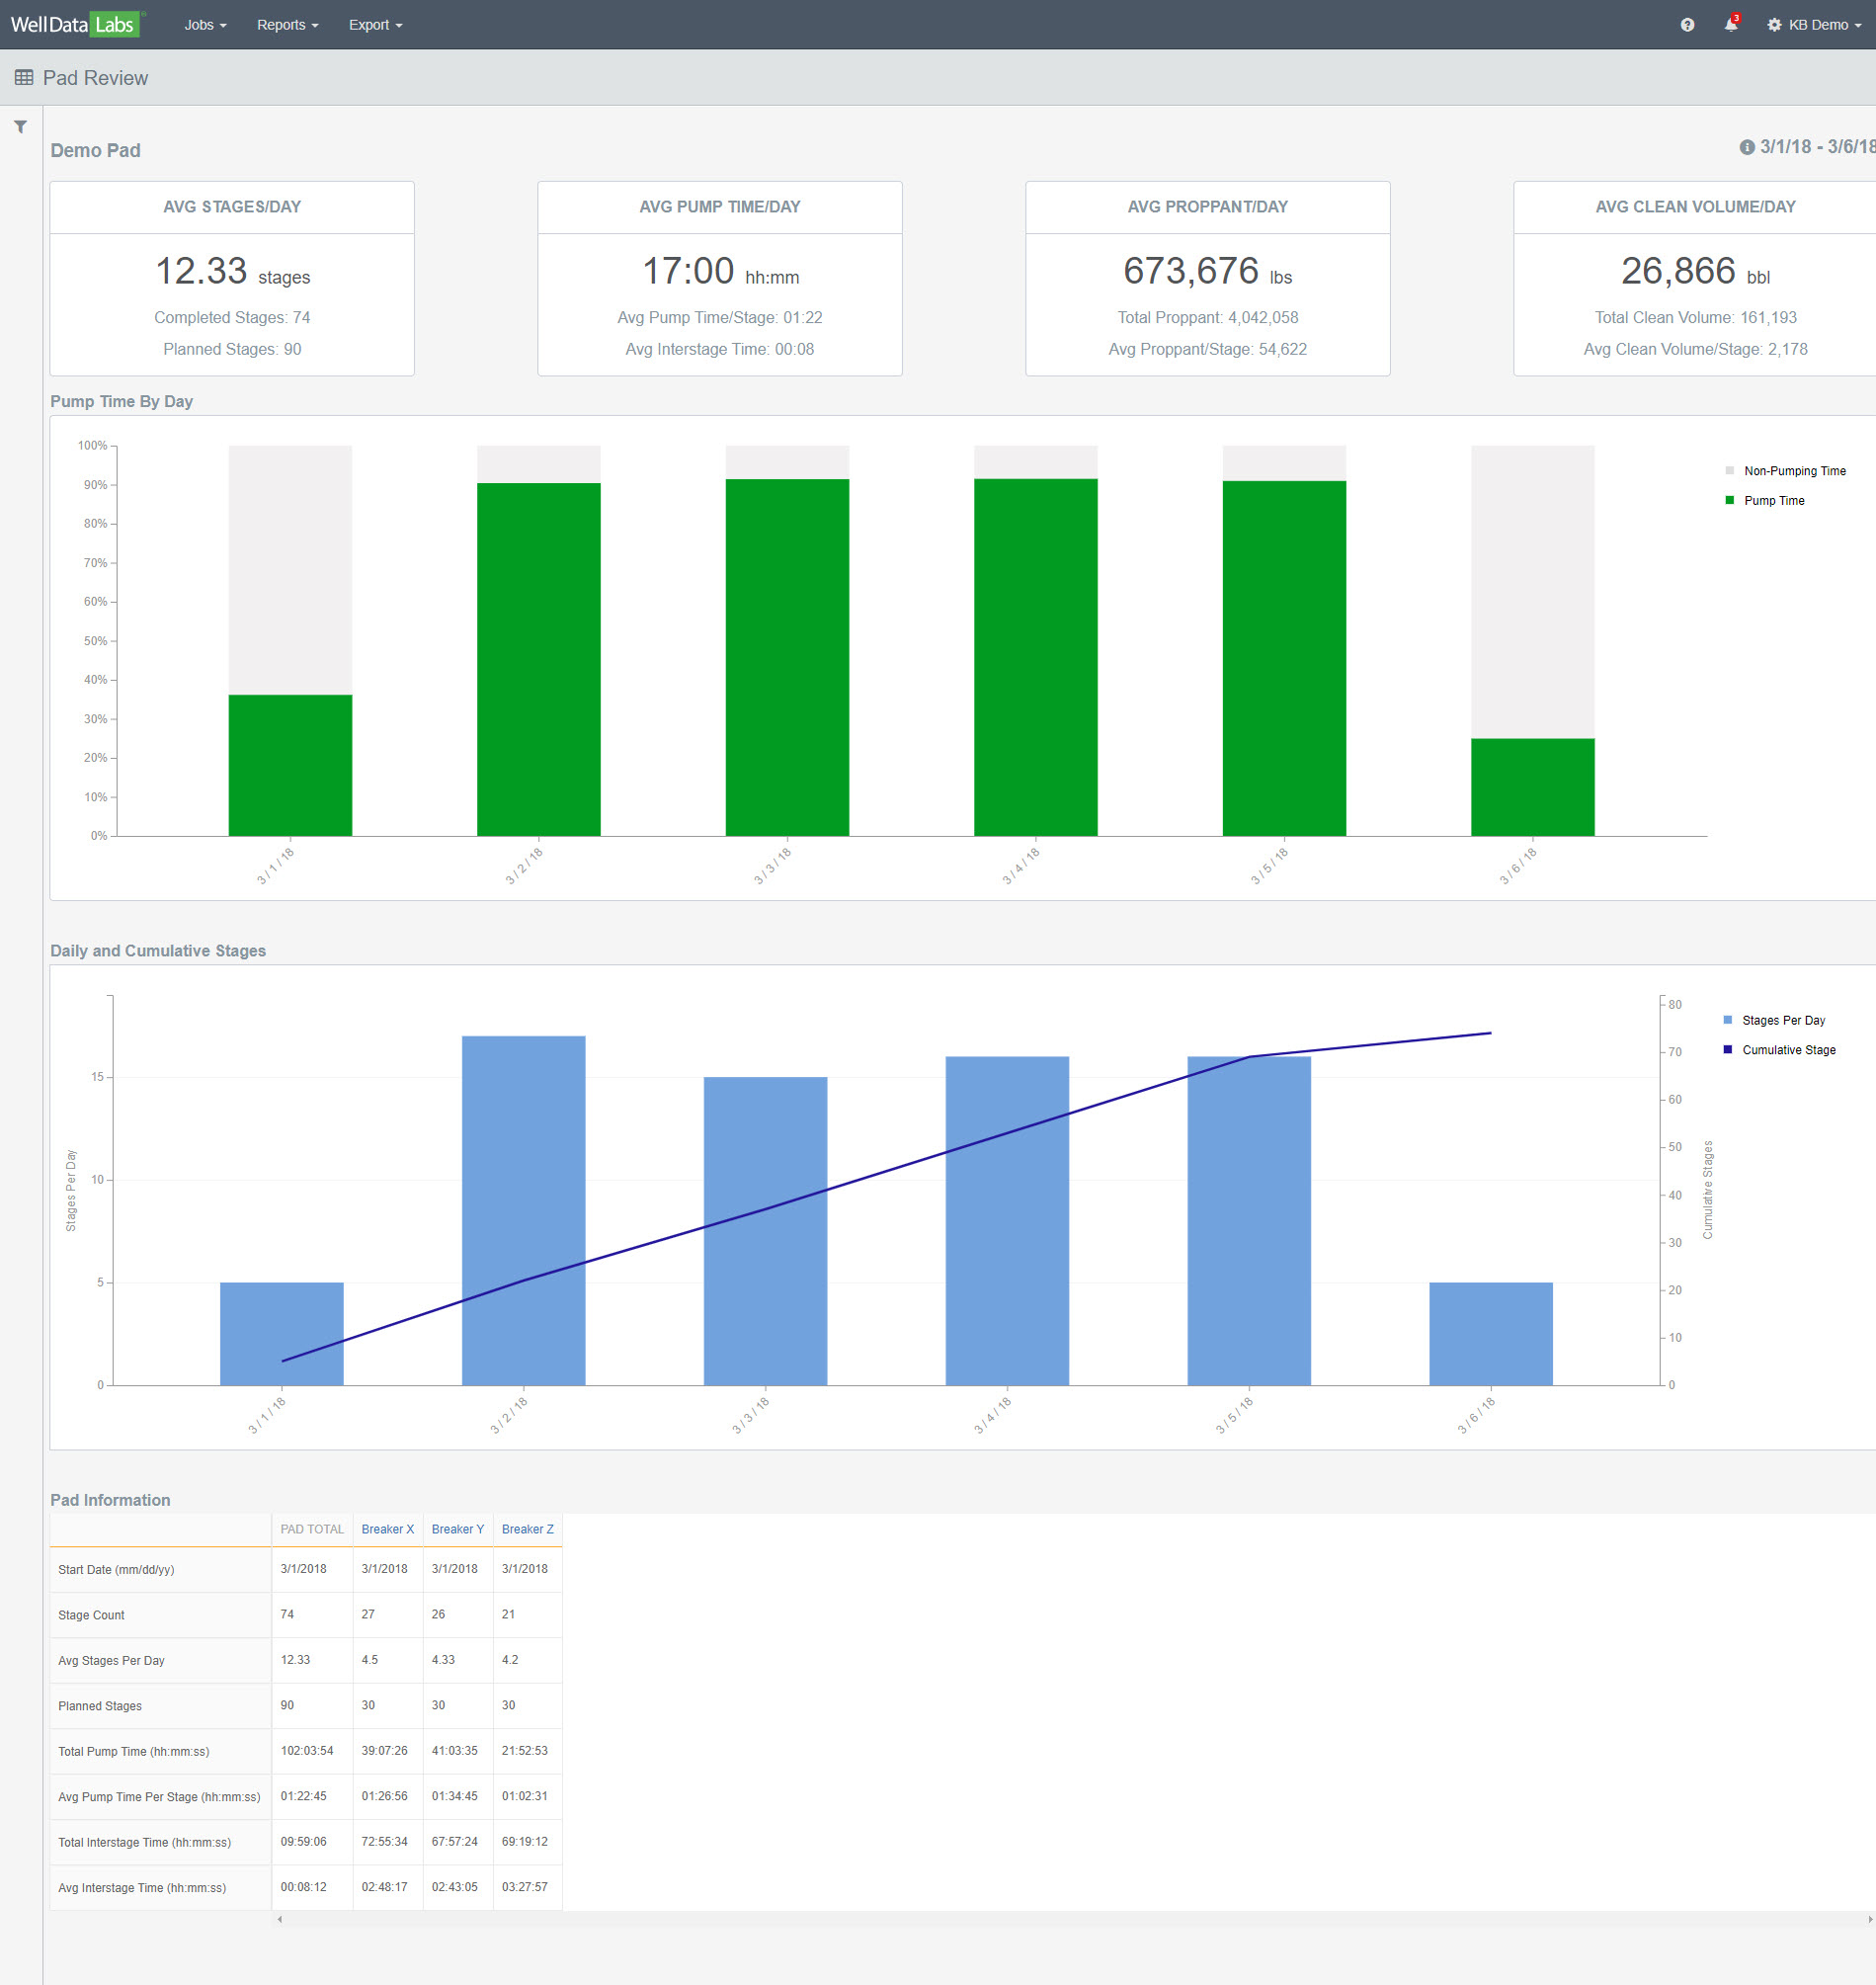
When the Pad Review report displays, notice the overview tiles contain the daily averages for your pad.
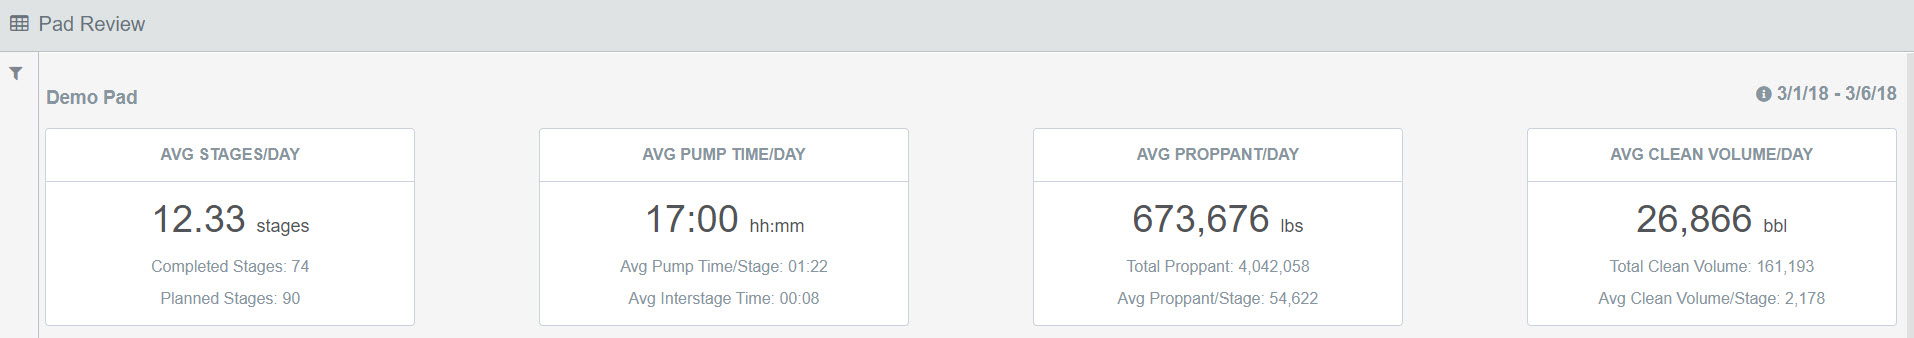
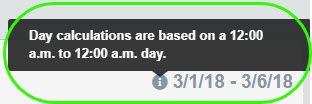
**Note: Hover your mouse over the information button in the upper right-hand corner of the page to display your day start time. If you need to have your Pad Review day start time changed, (we get it, not all frac days start at 5:00 am), reach out to us at support@welldatalabs.com and we'd be happy to update that for you!
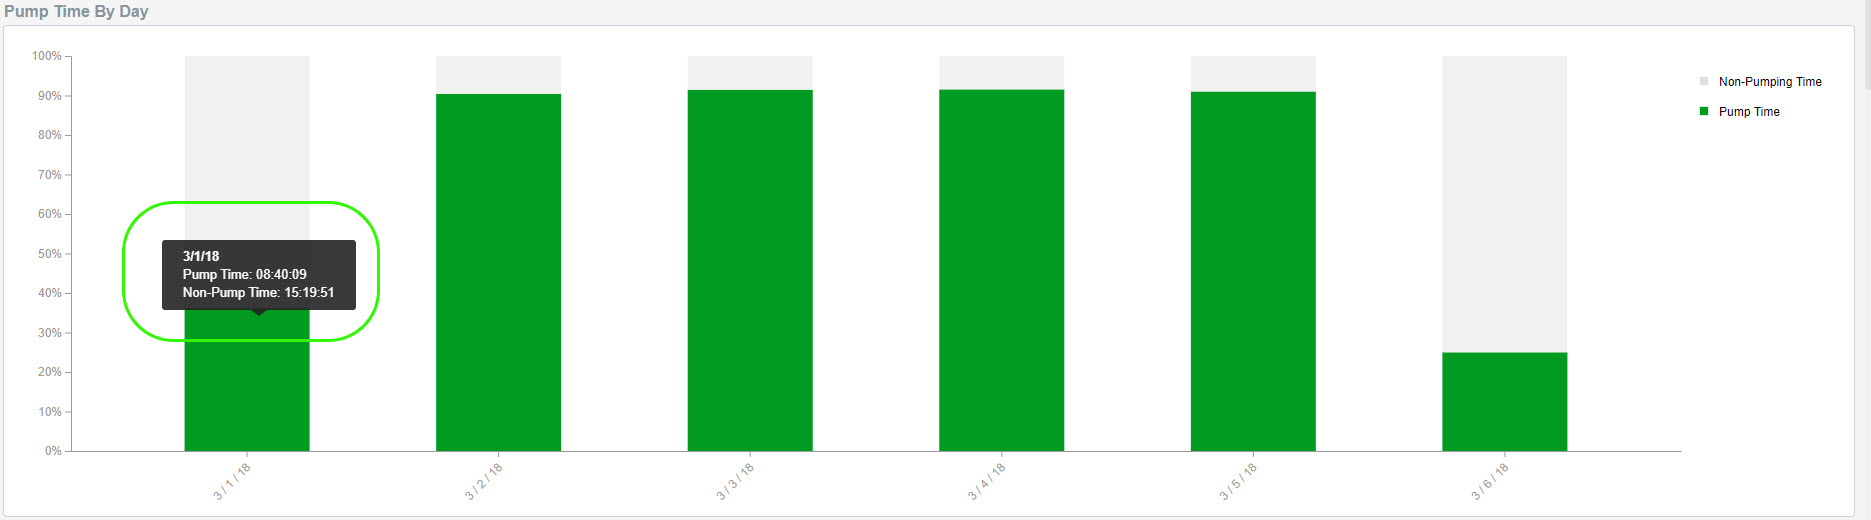
Pump Time by Day - Pump time is any time that fell between a stage’s start and end time. The stacked bar chart will show you the amount of pump time and non-pump time recorded during each day of your pad. Hovering your mouse over each of the bars will display the date and pump and non-pump time for each day.
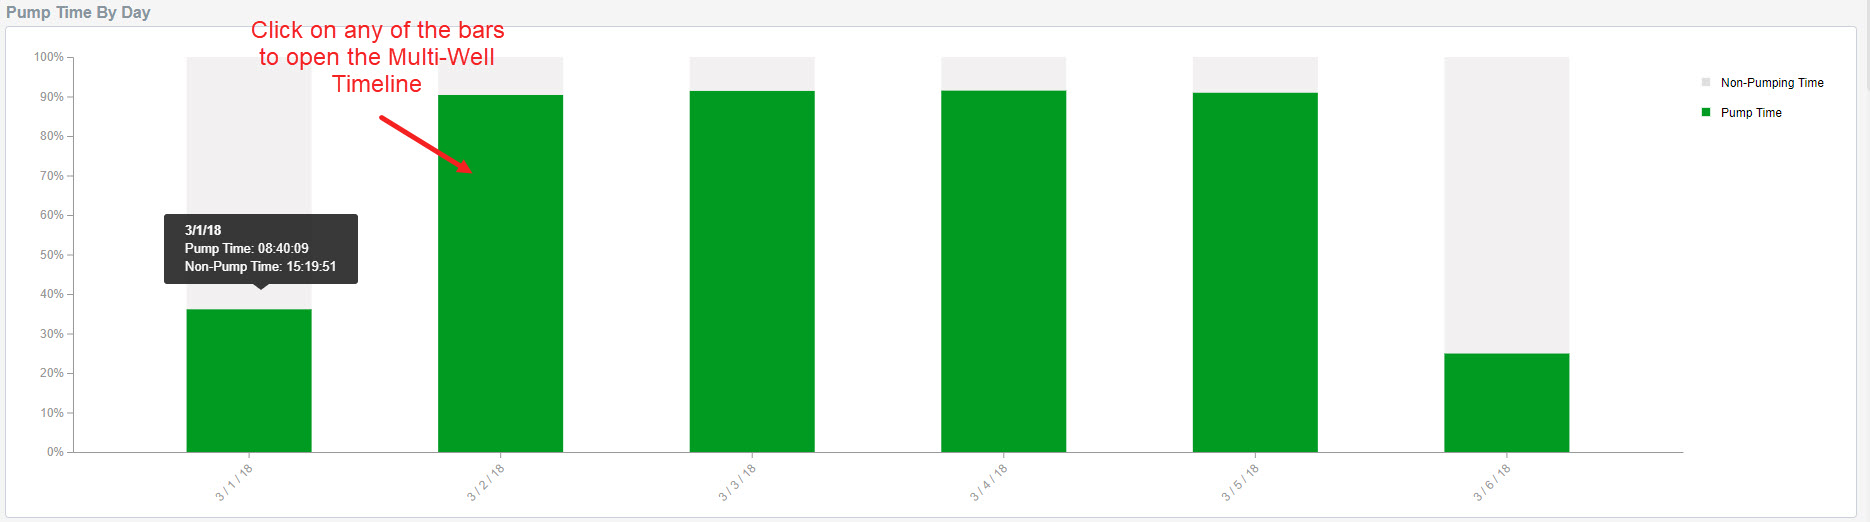
**Helpful Tip - Click on a bar on the Pump Time by Day chart and you will be taken to the Multi-Well Timeline where you can take a look at your per sec data.
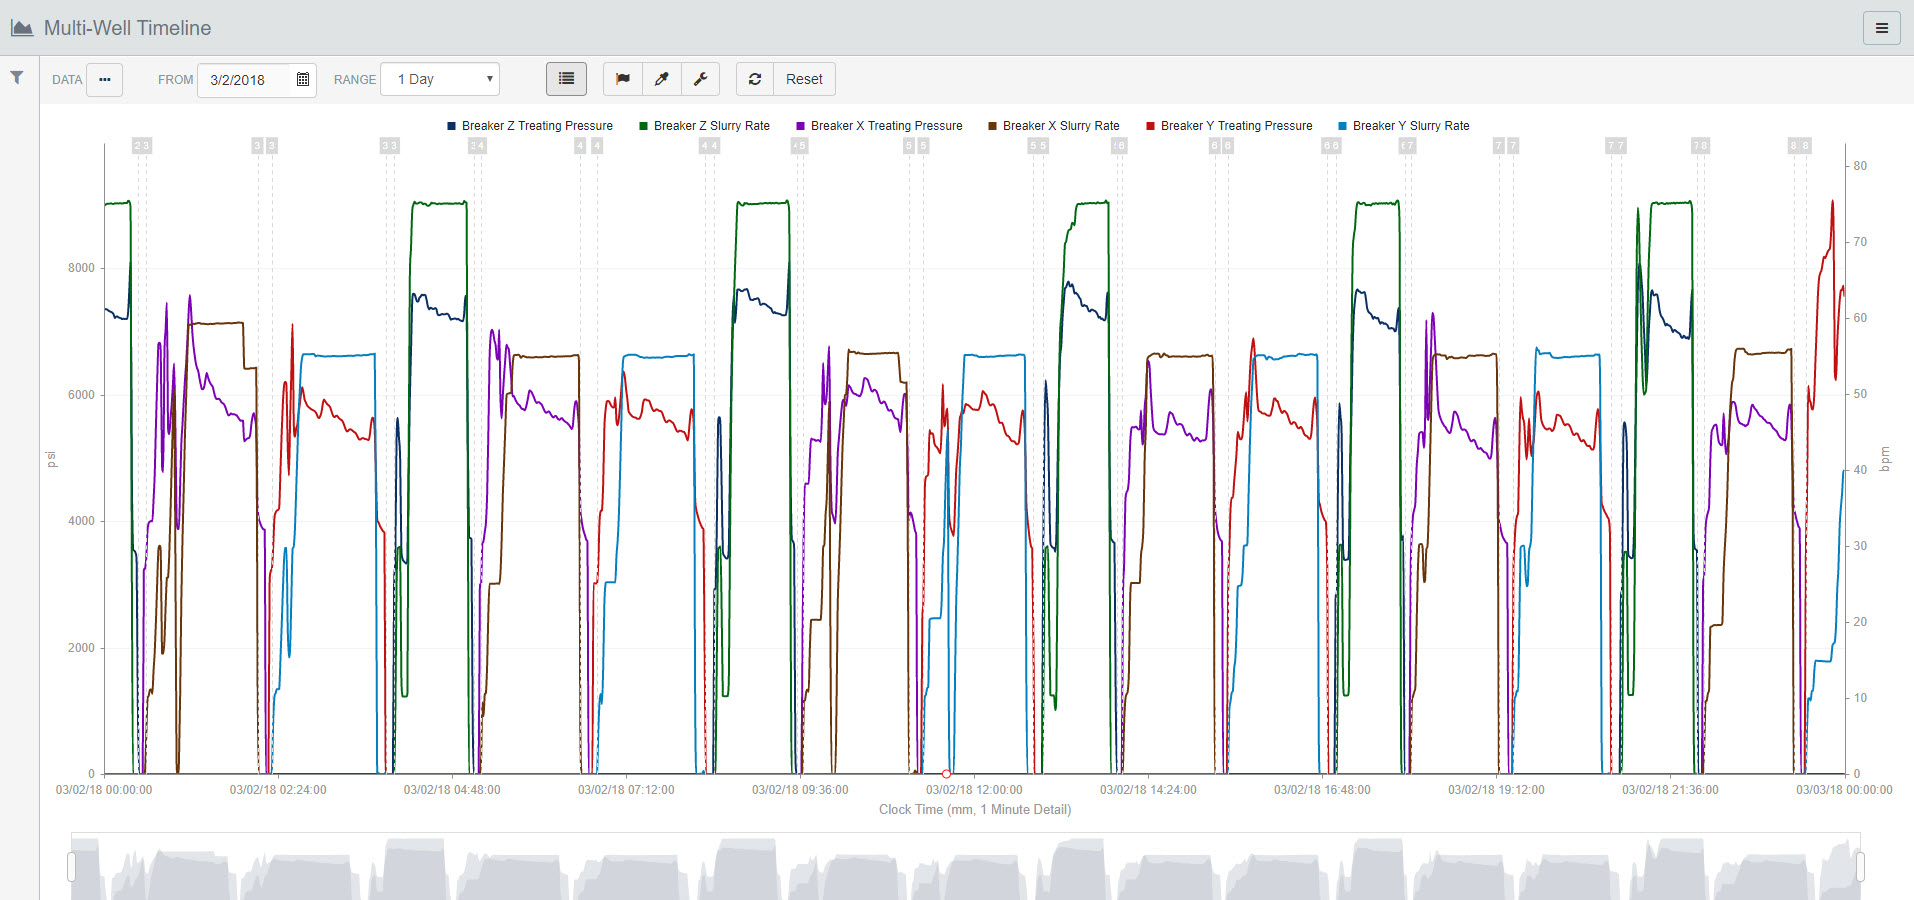
Click the back arrow on your browser to return to the Pad Review Report.
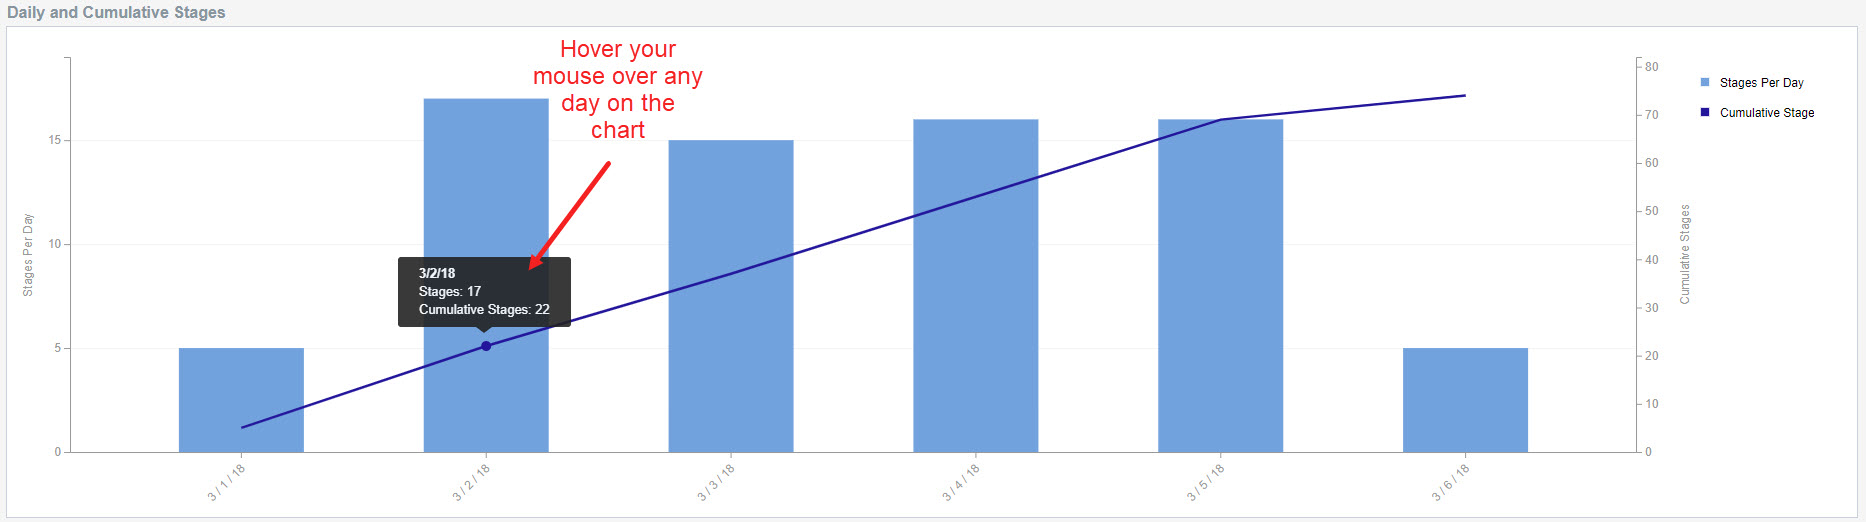
Daily and Cumulative Stages -this chart will show you how your pad is progressing over time in terms of completed stages. Mouse over any day to see the number of stages completed on that day as well as the cumulative stages completed up to (and including) that day.
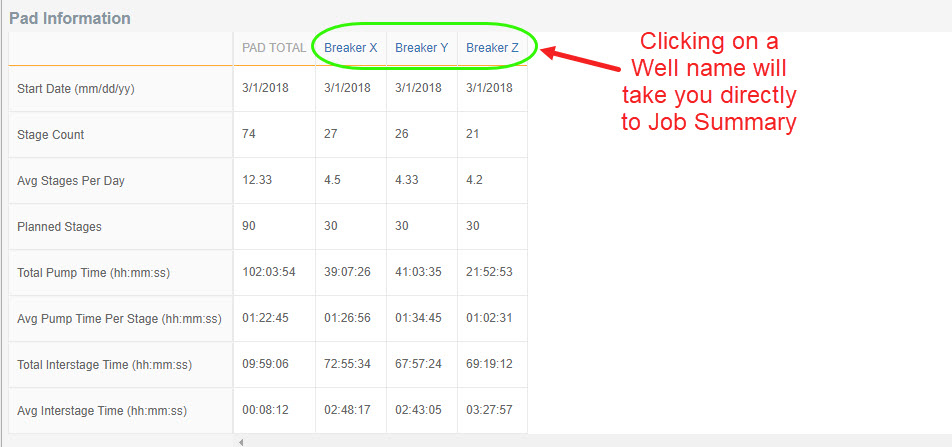
Pad Information – a handy grid that includes information including stats on stage count, averages per day, pump time, and interstage time for both your pad and the wells on it. If you need more detailed information about a particular well, click on the Well Name to see the Job Summary report.
We have a lot of great reports in Well Data Labs! If you would like to learn more about them, click on the Data Analytical Tools link.