The Stage Variance Report is a great way for you to take a look at metrics by stage for each well.
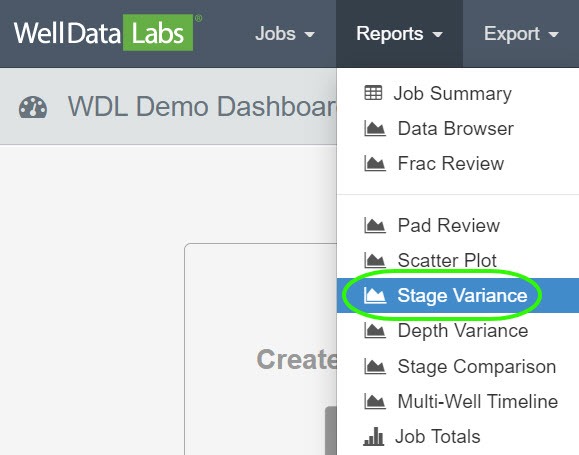
The report can be accessed by selecting Stage Variance from the Reports drop-down:
The Stage Variance Report has the same functionality as other reports. The filters section lets you quickly narrow down the list of elements and wells you would like to see on your chart. In this example, we are filtering the wells by Service Company and are selecting “Example Company”. Then, selecting from a list of Jobs that are mapped to Example Company. I.E. Demo Wells X, Y and Z. Click the Update button when you are finished.

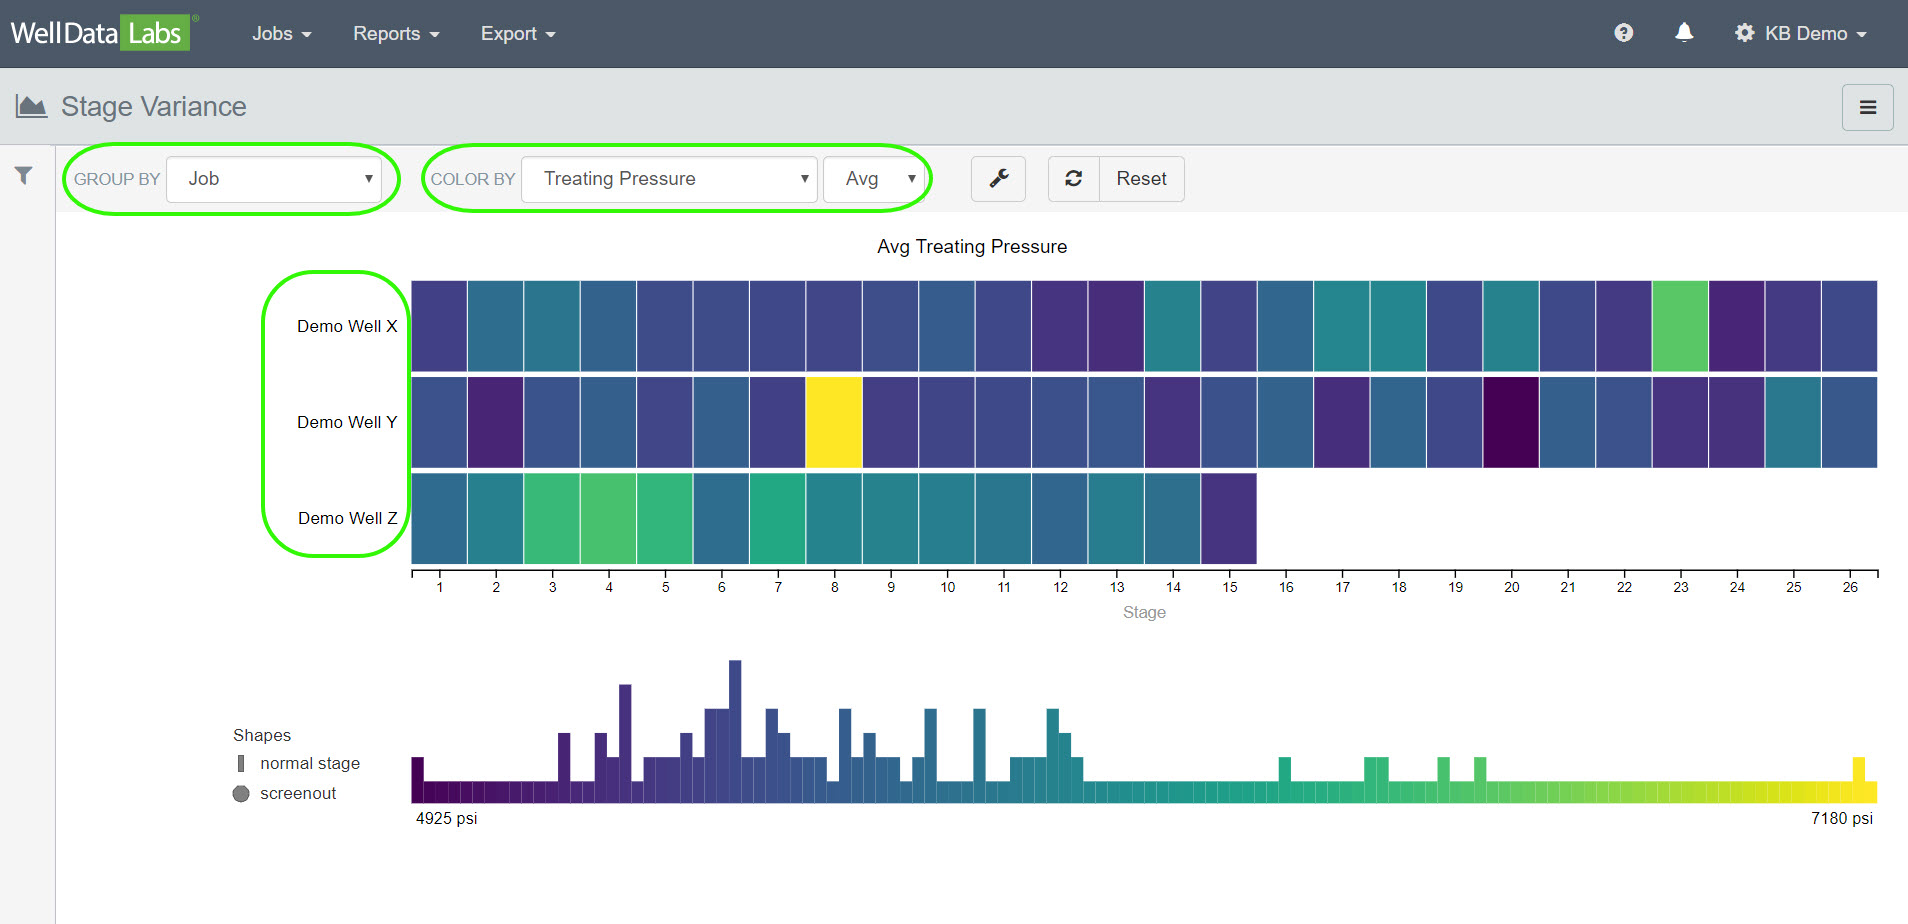
The Stage Variance Report displays the Average Treating Pressure by Color and is grouped by Job for the three wells that we selected.
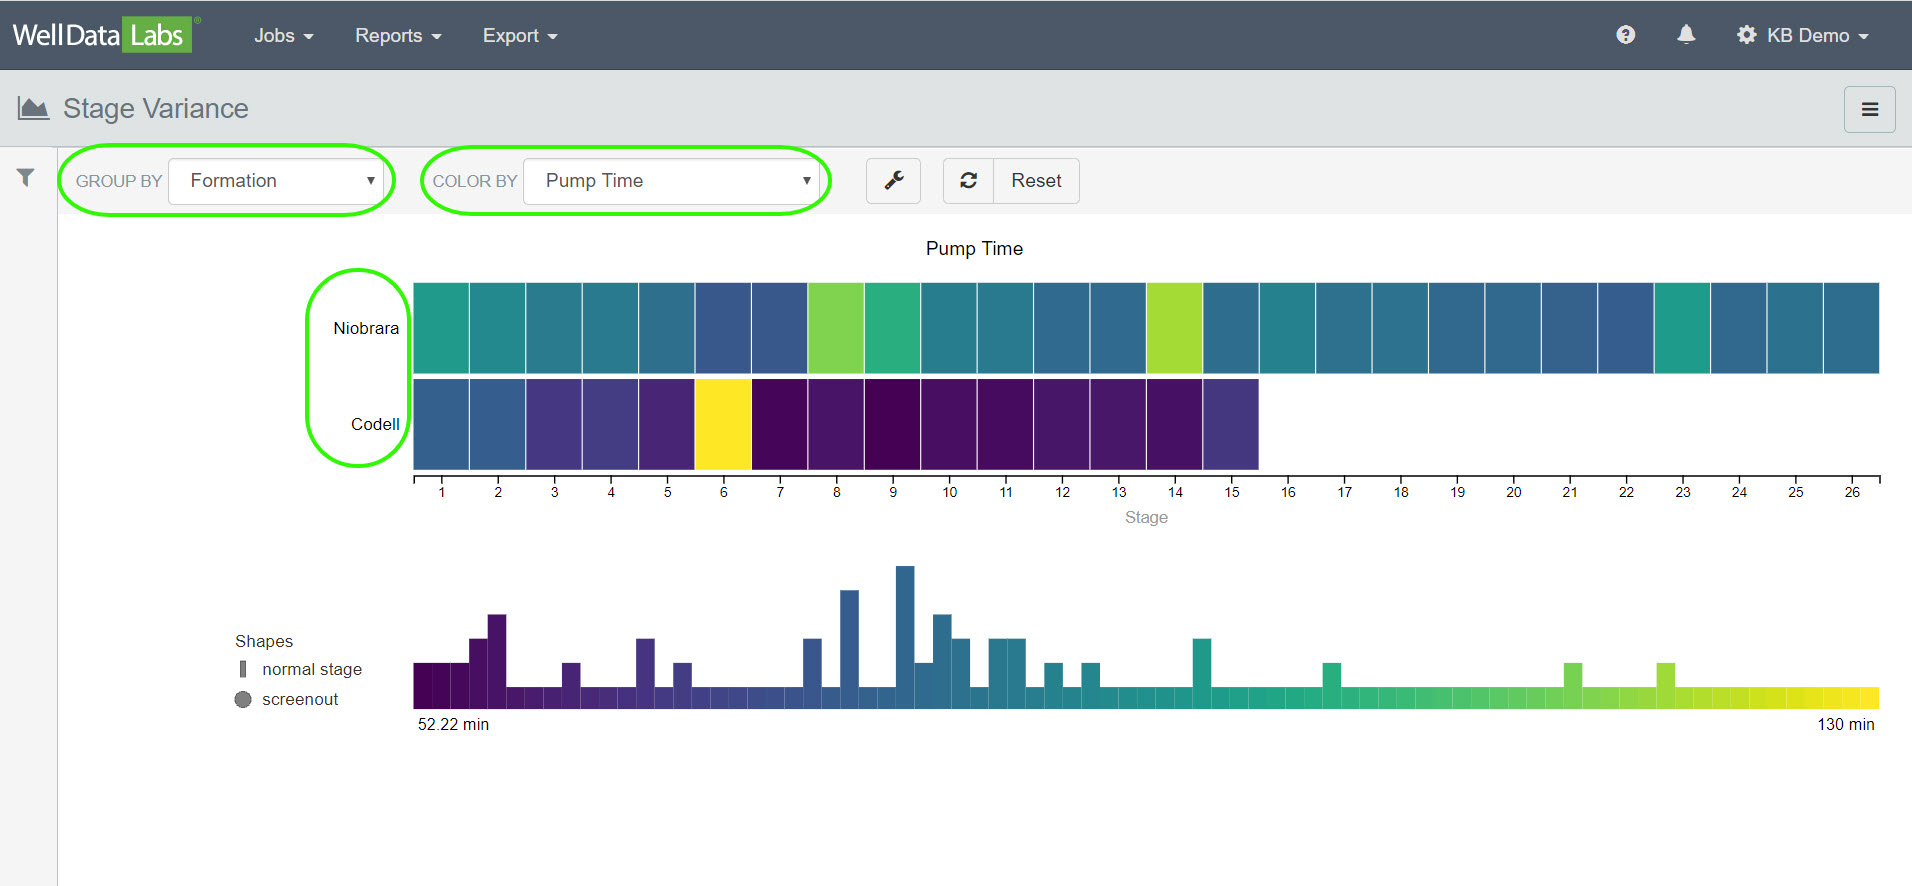
You can easily change the Group By and Color By in your chart by making a selection from the drop-down lists. Here we will change the Group By to Formation and the Color By to Pump Time.


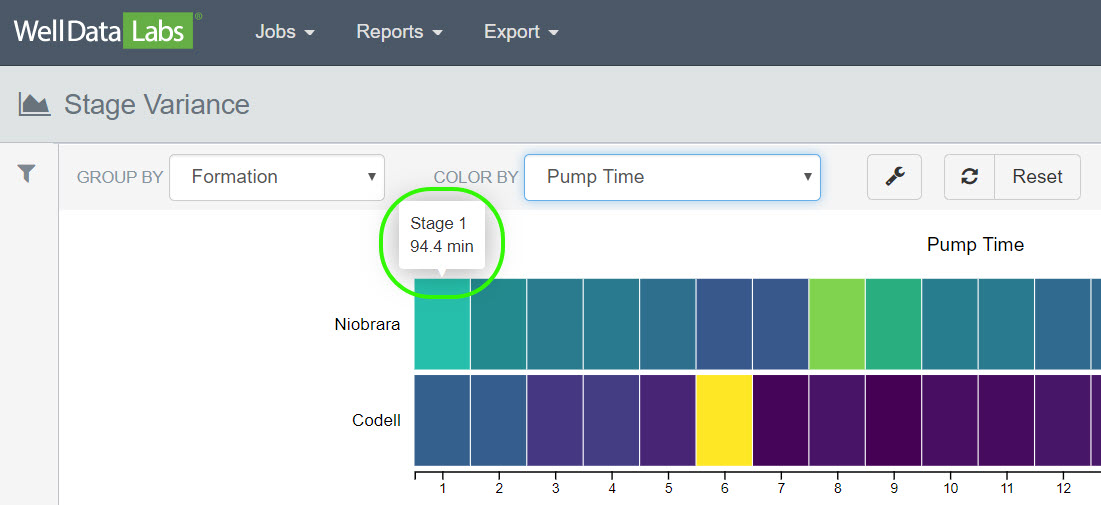
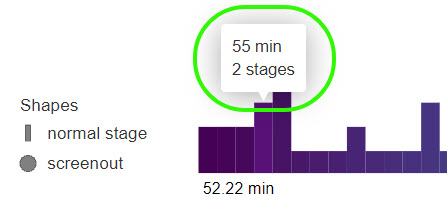
View information by each stage by hovering your mouse over each stage.
If you would like to return to the original report settings, click on the Reset button.

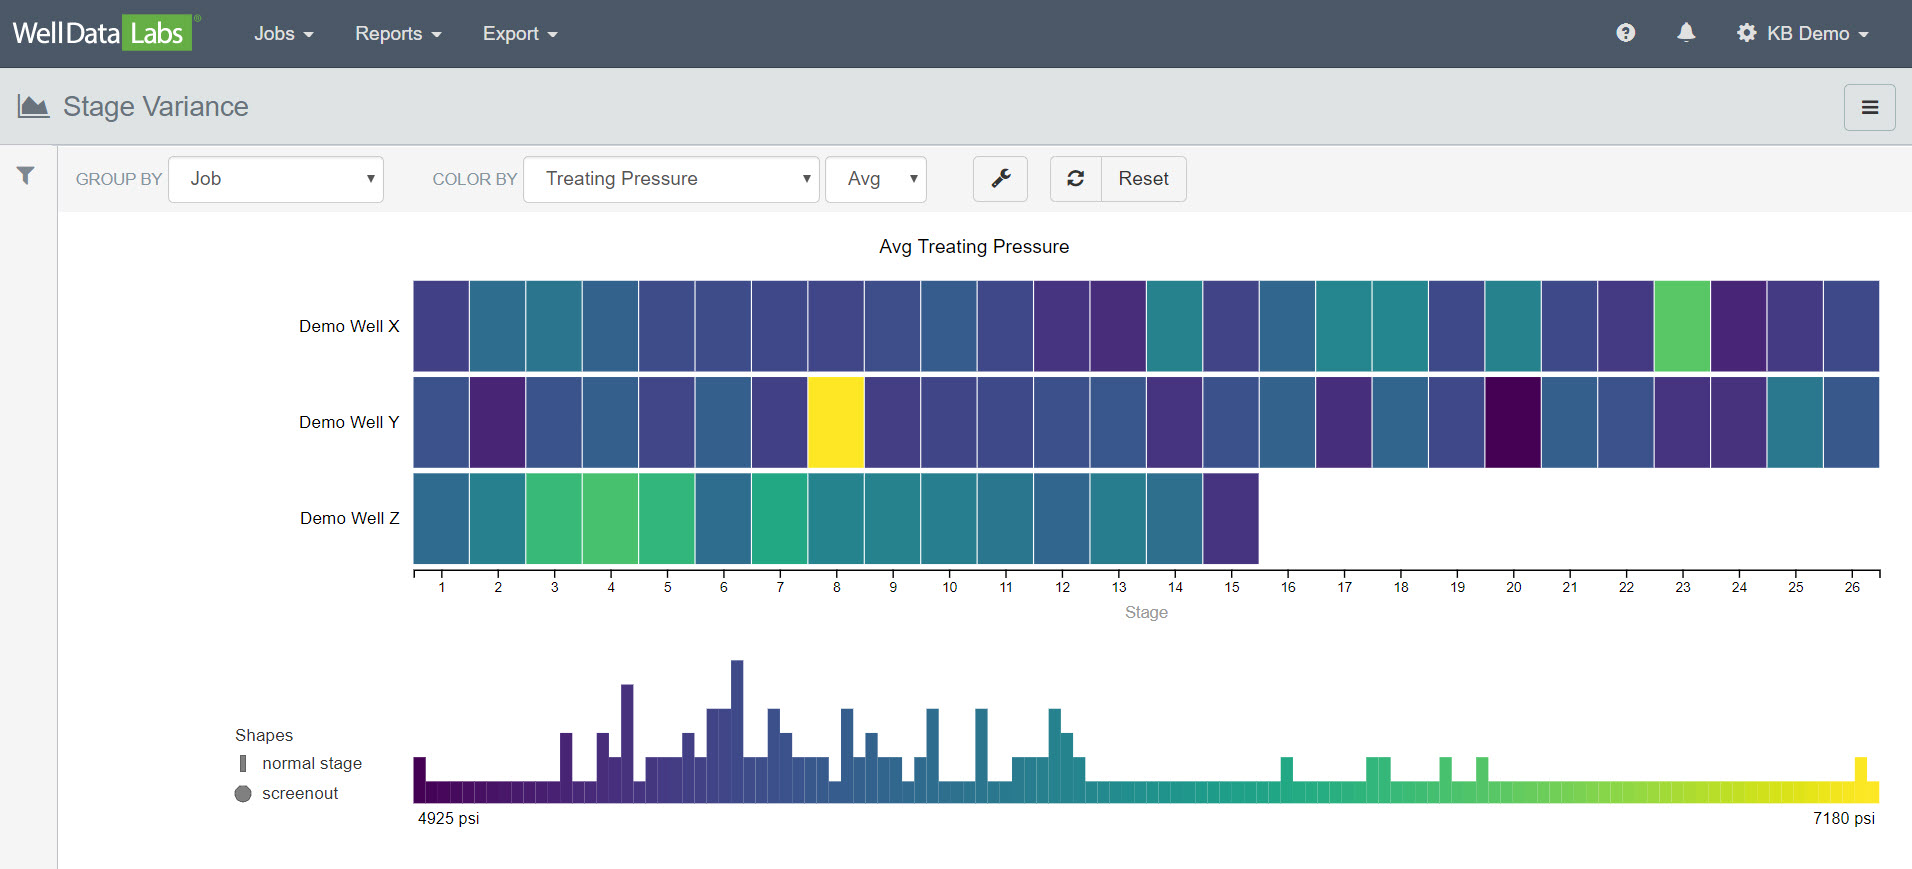
Chart Options:
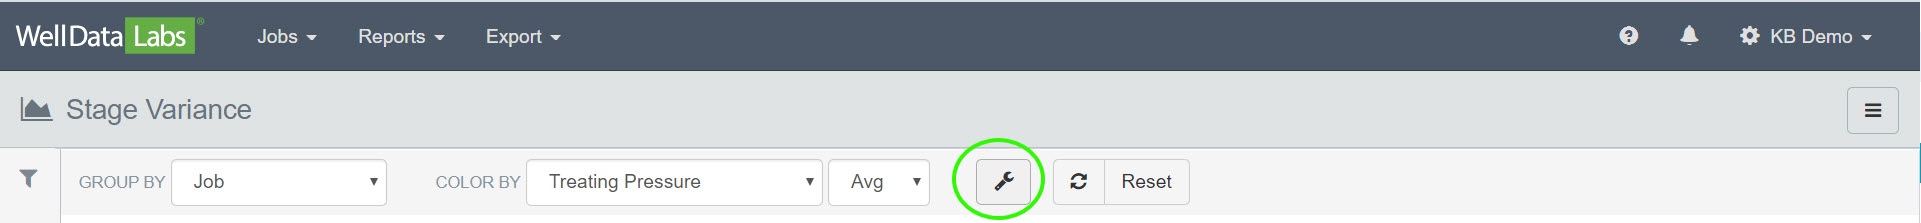
Clicking on the "wrench" icon on the toolbar will open a Chart Options window.
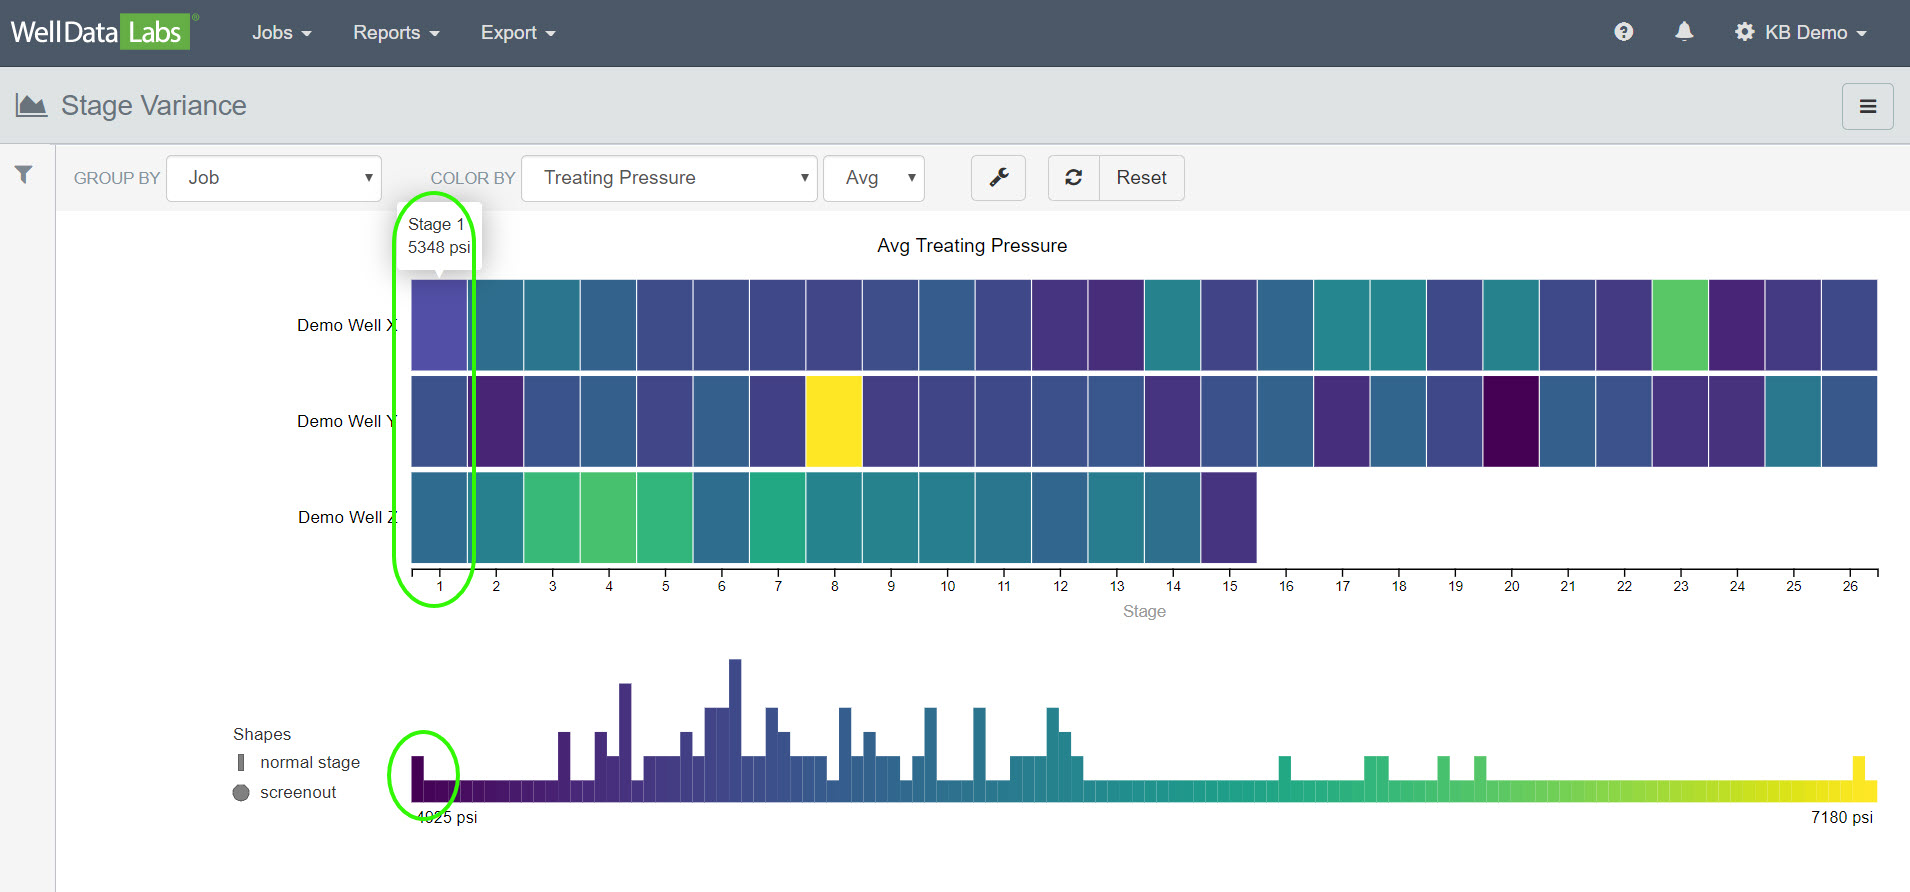
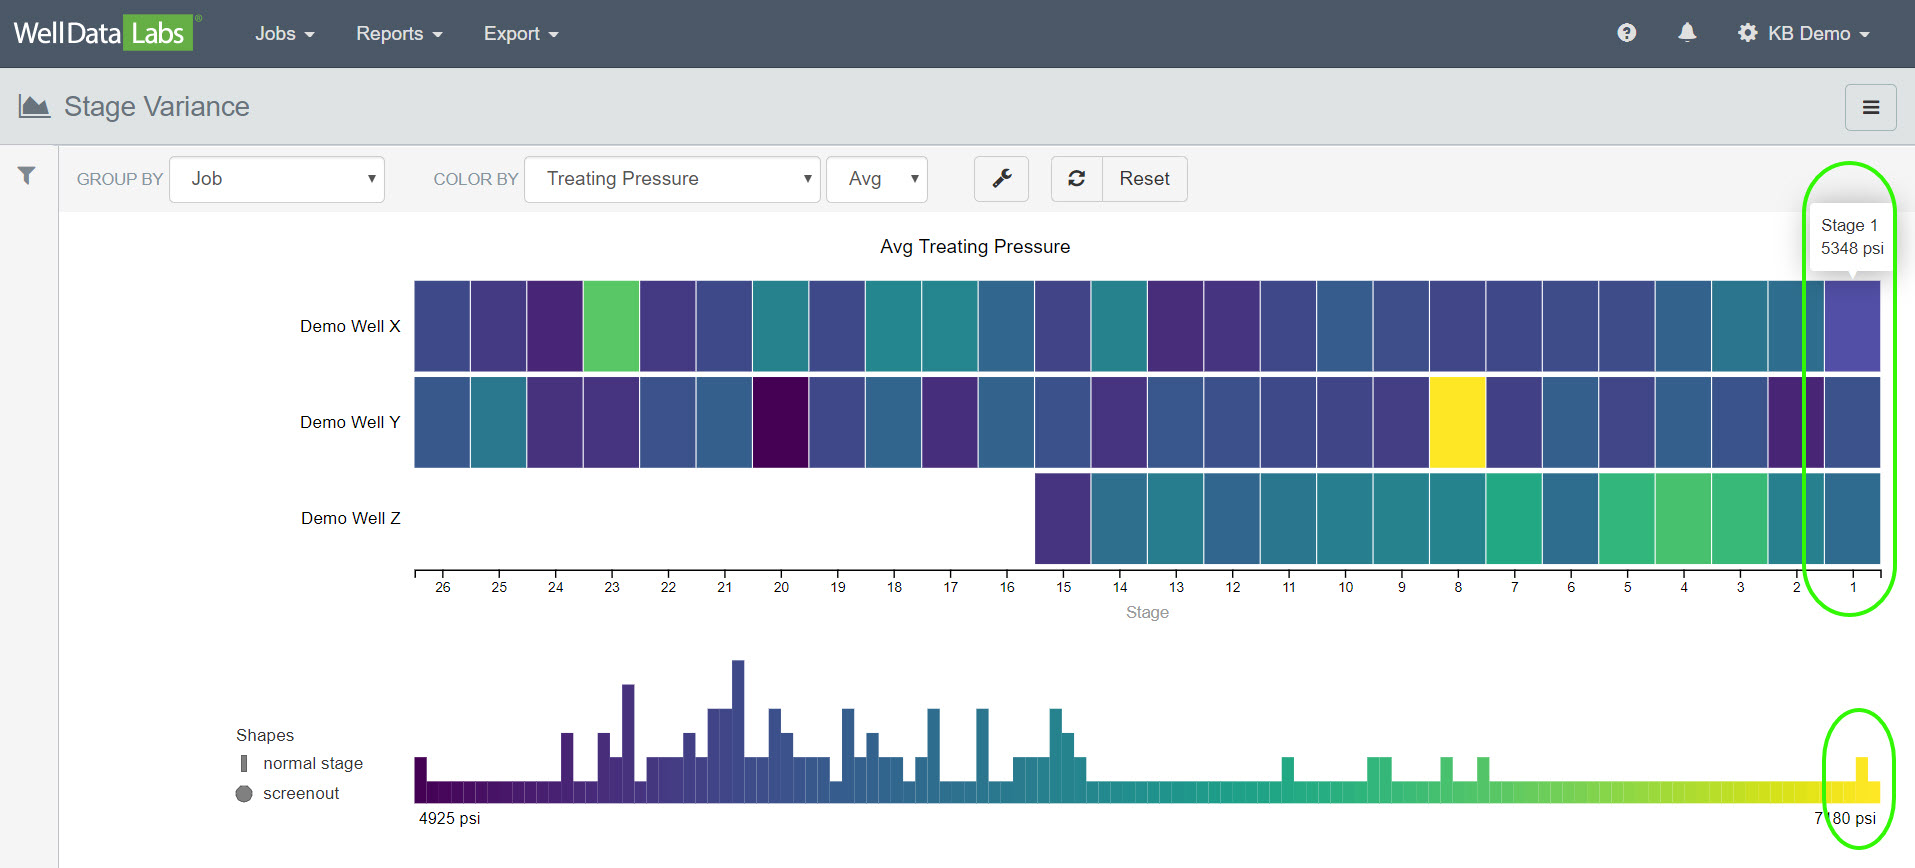
You will be able to customize your Color Scale and change your stage alignment to either have Stage 1 begin on the left-hand side of the chart or the right-hand side of the chart.
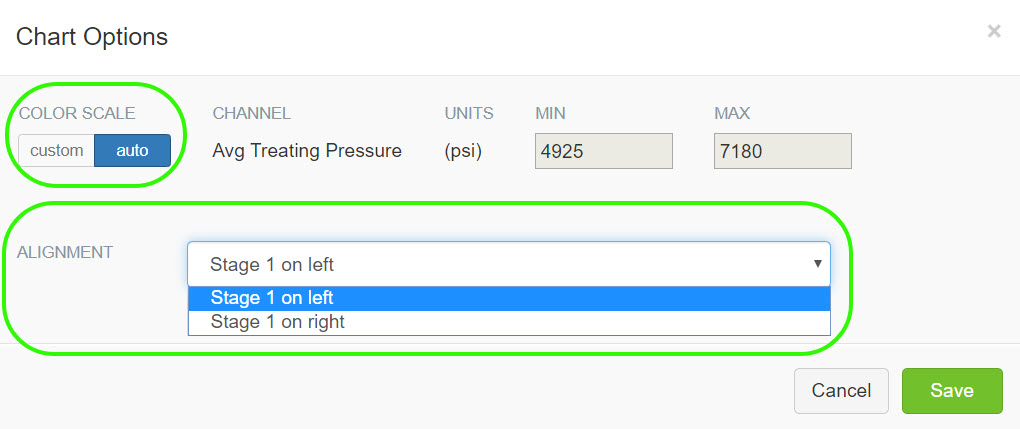
Stage 1 on left:
Stage 1 on right:
Print Editable Chart and/or Report to PDF:
You can easily print an editable Chart or Report to a PDF file by clicking on the 3-bar button in the upper right-hand corner of each page and making a selection.


We have a lot of great reports in Well Data Labs! If you would like to learn more about them, click on the Data Analytical Tools link.