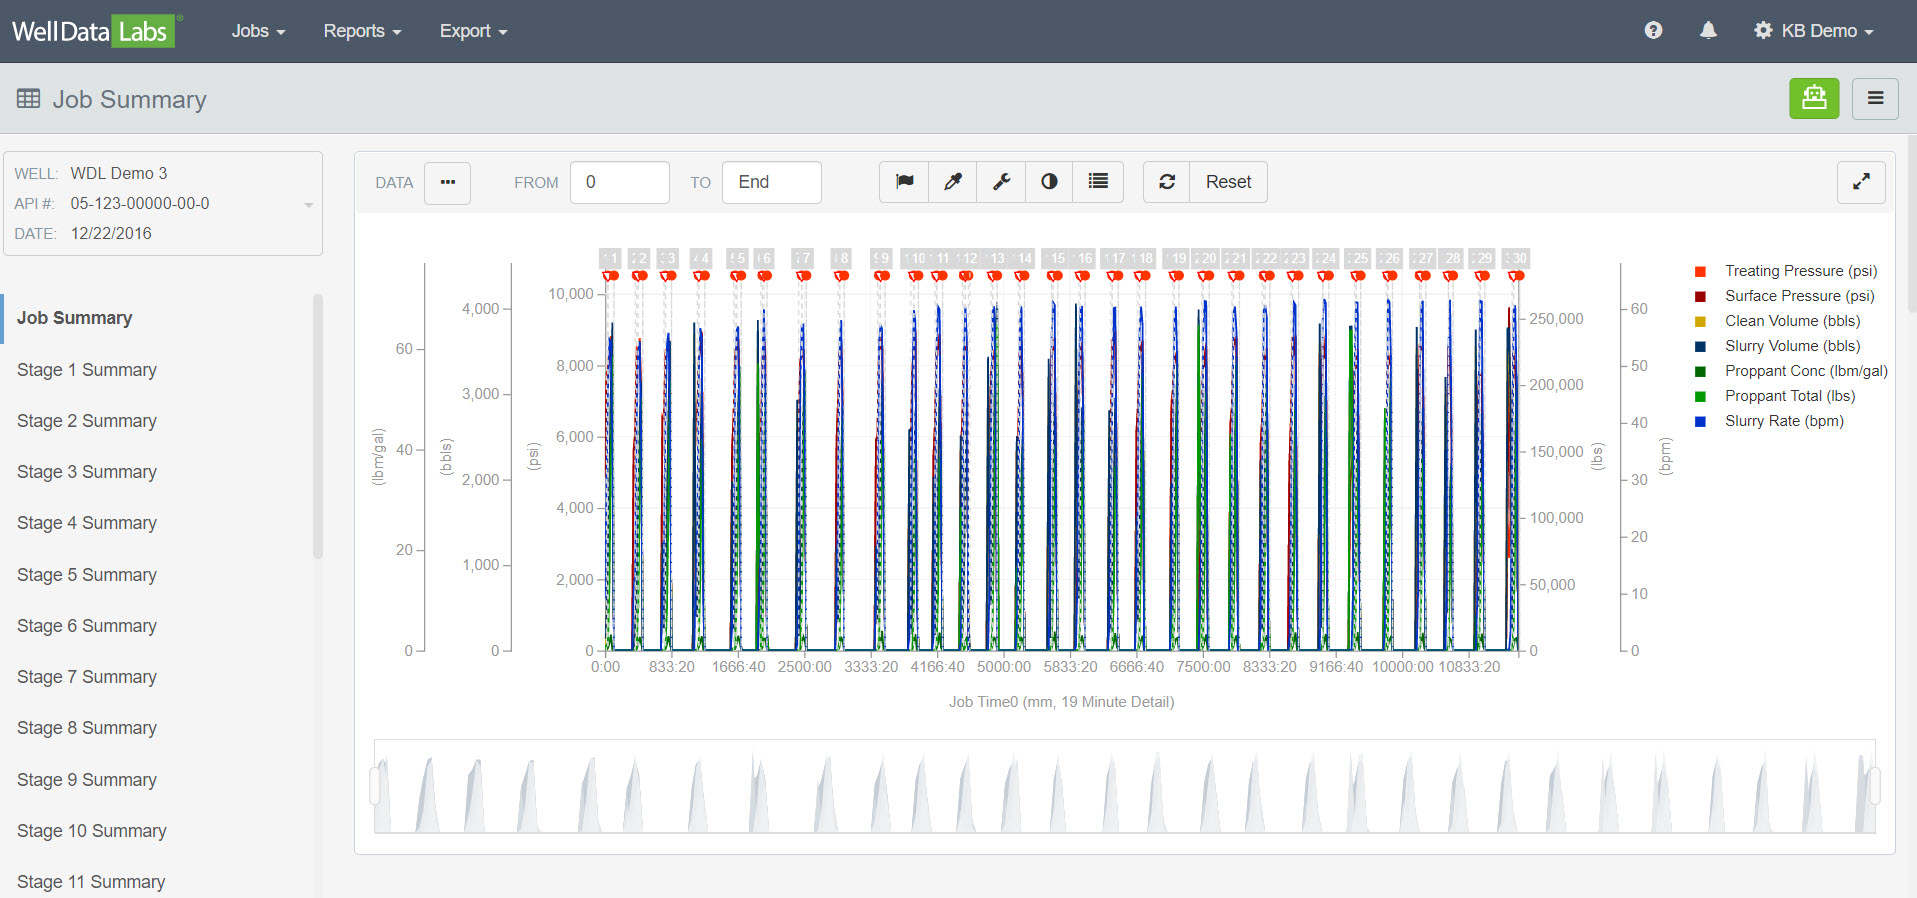
Well Data Labs provides quick and accurate summary data from your jobs. Let's take a closer look at the tables below the Job Summary graph.
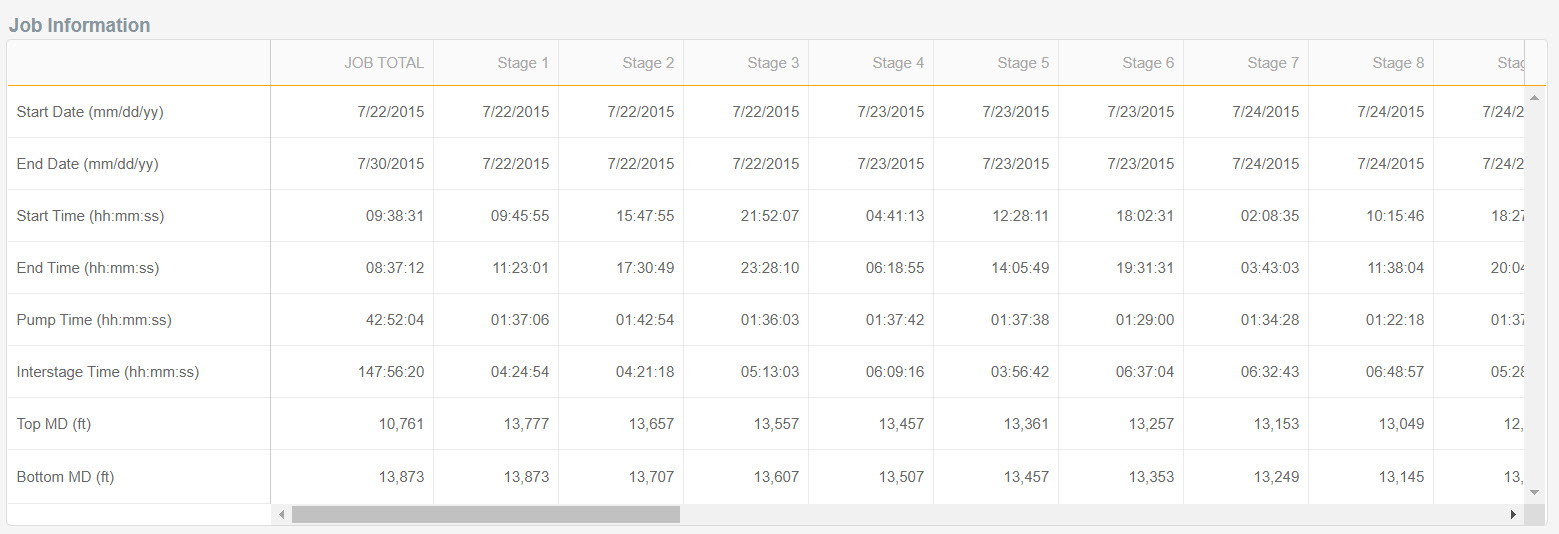
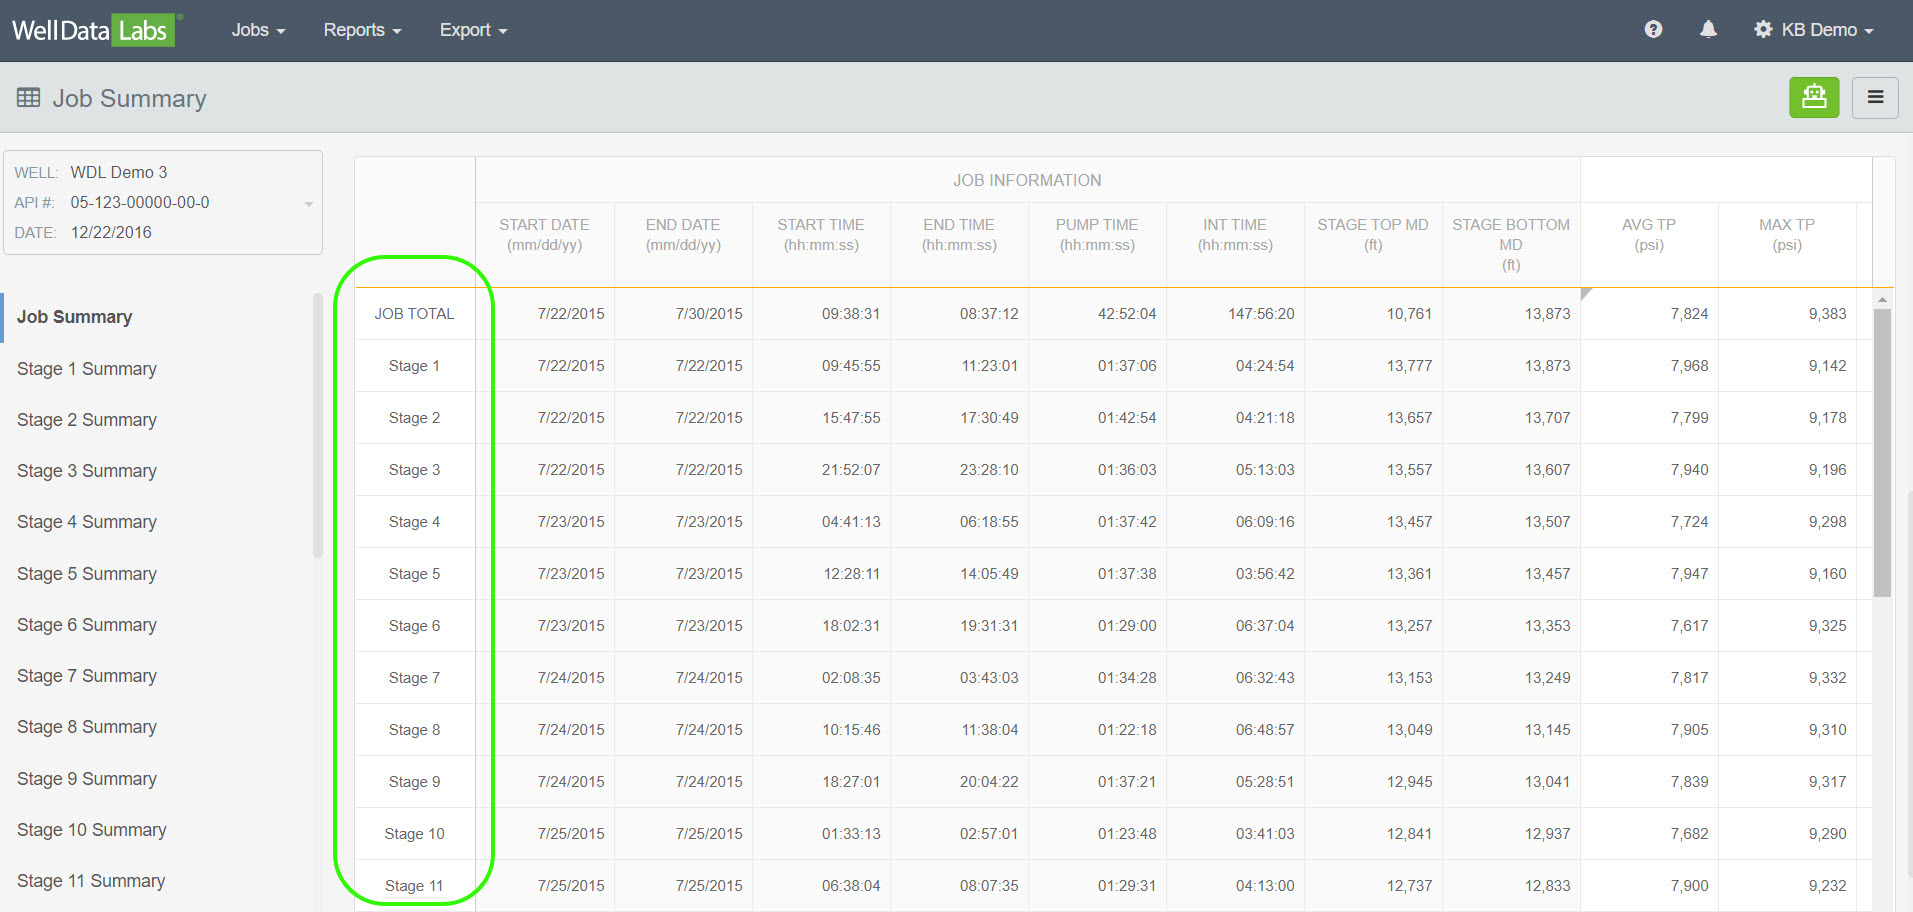
The first table sitting directly below the graph is the Job Information table. This table gives the start/end date and time, and top/bottom measured depths for the entire job and for each stage. The Stage Mappings page allows you to adjust the times of each stage, while the measured depths are calculated from the Depth Features table on the Treatment Data page.
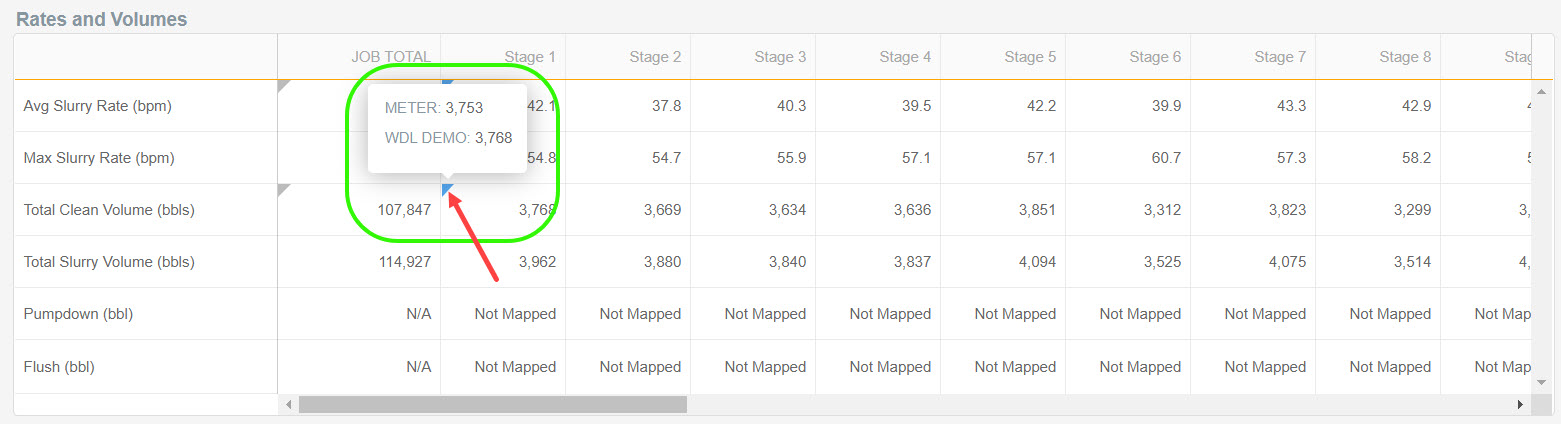
The following tables give the average and max values for the elements in each section. You'll also find the data that was entered on the Treatment Data page for each stage, including the detailed information for any Proppant, Fluids & Chemicals, and Tracers.

The Job Summary tables display the overrides made on a particular value. They can be seen by hovering over the small flag (caret) in the upper left-hand corner of the cell, where you'll find the original calculated "meter" value along with a quick record of where any overrides came from. If a comment was left on an override, it'll also be shown in the mouse-over popup.
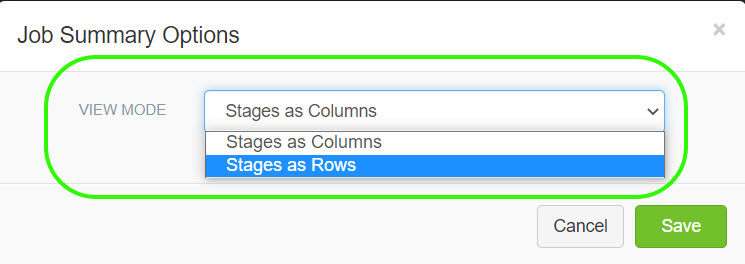
The Job Summary tables also have different display options. To find them, select Job Summary Options under the 3-bar button in the upper right-hand corner of the page.
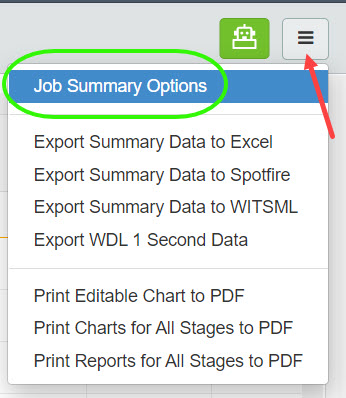
You can customize the table visualization mode having the Stages as Columns or the Stages as Rows.
The tables on Job Summary are not the only place to find your data in a tabular format. Take a look at the articles for Data Export and Stage Summary to learn more how we display your data in Well Data Labs.