Once your data is loaded, Well Data Labs will automatically begin the process of Stage Mapping. You should plan to navigate to the Stage Mappings page to validate the the Stage Start/End Times picked by the Well Data Labs Power-Up.
There are a few options you can take to access Stage Mappings.
From anywhere in the application:
Select the Jobs drop-down in the toolbar, then select Stage Mappings.

From the Workflow Navigator:
Select Stage Mappings.


Choose the well to be mapped from the well drop-down located on the upper left-hand side of the page.

Setting Stage Start/End Times:
When the Stage Mappings page opens, click the Set Stage Times button.

From the popup window enter the number of stages for the job, click Save.

Click OK to set the stage start and end times.

If you need to make changes to the number of stages you have selected, select the 3-bar button in the upper right-hand side of the toolbar. You can easily Edit the number of stages, Insert more stages or Delete a stage by clicking on either option. You can also follow the link to the Import Treatment Data section of the Job View page from this menu.

After entering the number of stages, a table with the number of stages you selected will appear below the chart. We've already populated the table using the file Start and End times. If needed, click the Edit pencil next to the Start Time or End Time in the table to shift the Stage Flag. Or you can manually enter the Start Time and End Time for each stage using a MM/DD/YY hh:mm:ss format.

Or, after you click the Edit pencil, simply hover over the graph and click the point that represents your desired time. Repeat for the rest of the stages that need to be set.

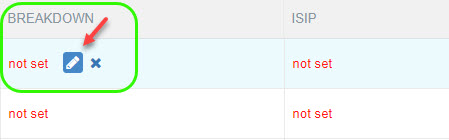
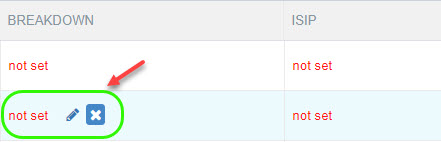
The End Time, Breakdown Pressure, and ISIP flags are each picked in the same manner as the Start Time. Click on the Edit pencil next to the element that you'd like to set or change, and click on your desired value in the graph. If you need to cancel the edit before you make a pick, there's a Cancel Button on the table next to the element you are editing or you can just hit Escape on your keyboard.
Graph Features
On the graph, in addition to whatever data elements you're displaying, you'll have the Start and End Time flags, which are the gray boxes on top of a dashed gray line. The Breakdown Pressure and ISIP appear as a dot, colored the same as your Treating Pressure element, connected to a dashed gray line. And comments appear as an open red circle on the x-axis of the graph.
Hover your mouse over a Breakdown Pressure or ISIP flag to quickly see the title and value of that flag. To view a comment's text along with data from that point in time, hover over its marker. There are a lot more graph features and customization options in Well Data Labs. Learn about them in our Graph Features article.

There are a lot of features in our Data Mapping pages. To learn more, click on the link!