What can we help you with today?
Get help straight from the team at Well Data Labs...
Frac Review: Single Well Analysis - Report Overview
Reports/Data Analytical Tools
Frac Review: Single Well Analysis - Report Overview
Updated 1 week ago
If you would like the convenience of an interactive post job report, we have made it easy with our Frac Review Reports. By using these reports, you will be able to choose the Pressure, Proppant and Chemical data you would like to see in our Scatter Plot and Stage Comparison charts - all on one page! And for Pump Time, you can easily view the Stage variances and Interstage Times.
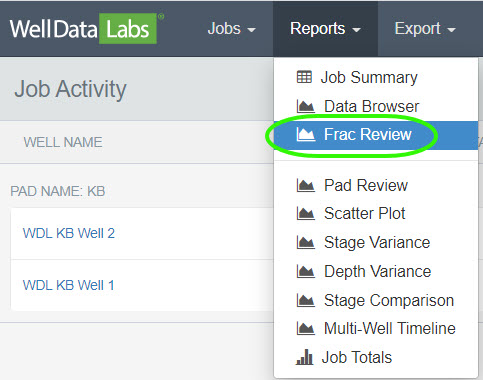
You will find the Frac Review Reports in the Reports drop-down on the toolbar.
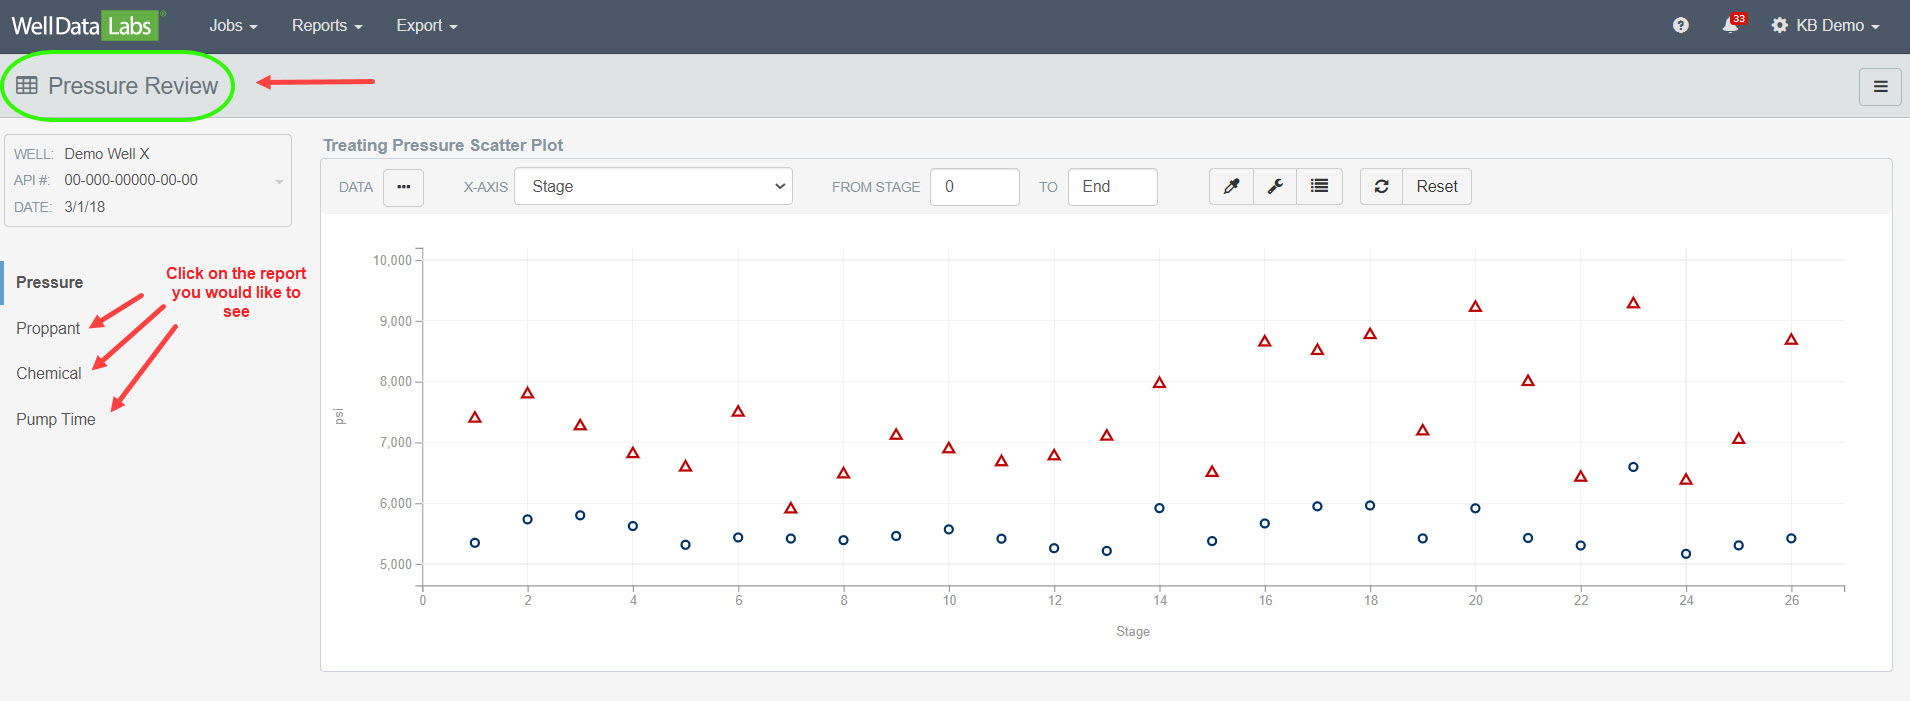
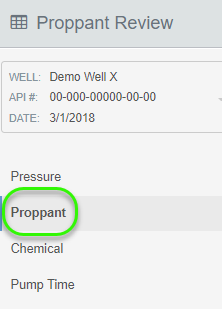
Once you select Frac Review, you will automatically be on the Pressure Reviewpage. This is also where you can navigate to the additional Frac Review Reports; Proppant, Chemical and Pump Time. They are listed on the left-hand side of the Pressure Review page directly underneath the Well Name and you can open them by clicking on the one you would like to see.
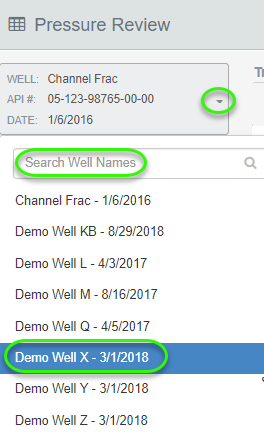
Find the well you would like to analyze by clicking on the down arrow next to the API # in the Job Selector on the upper left-hand side of the screen or by typing the well name in the Search Well Names field.
Pressure Review:
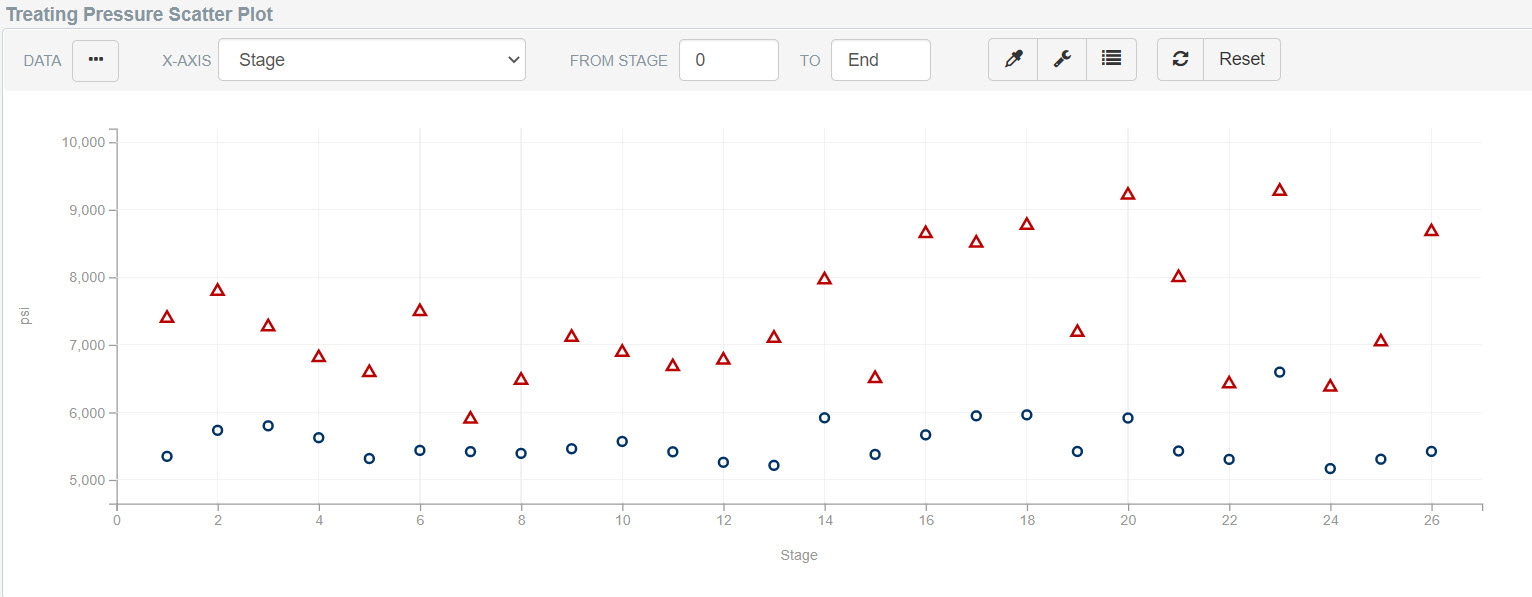
On the Treating Pressure Scatter Plot page, scroll down and you will see a plot for Treating Pressure, ISIP, and Treating Pressure Stage Comparison.
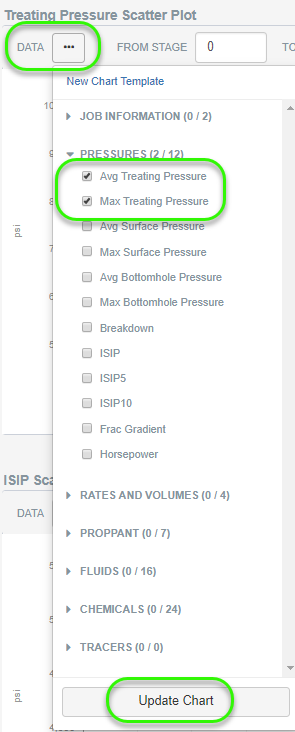
On each of the plots, select the data elements you would like to take a look at by clicking on the 3-dot button next to Data on the toolbar. Click Update Chart when you are finished.
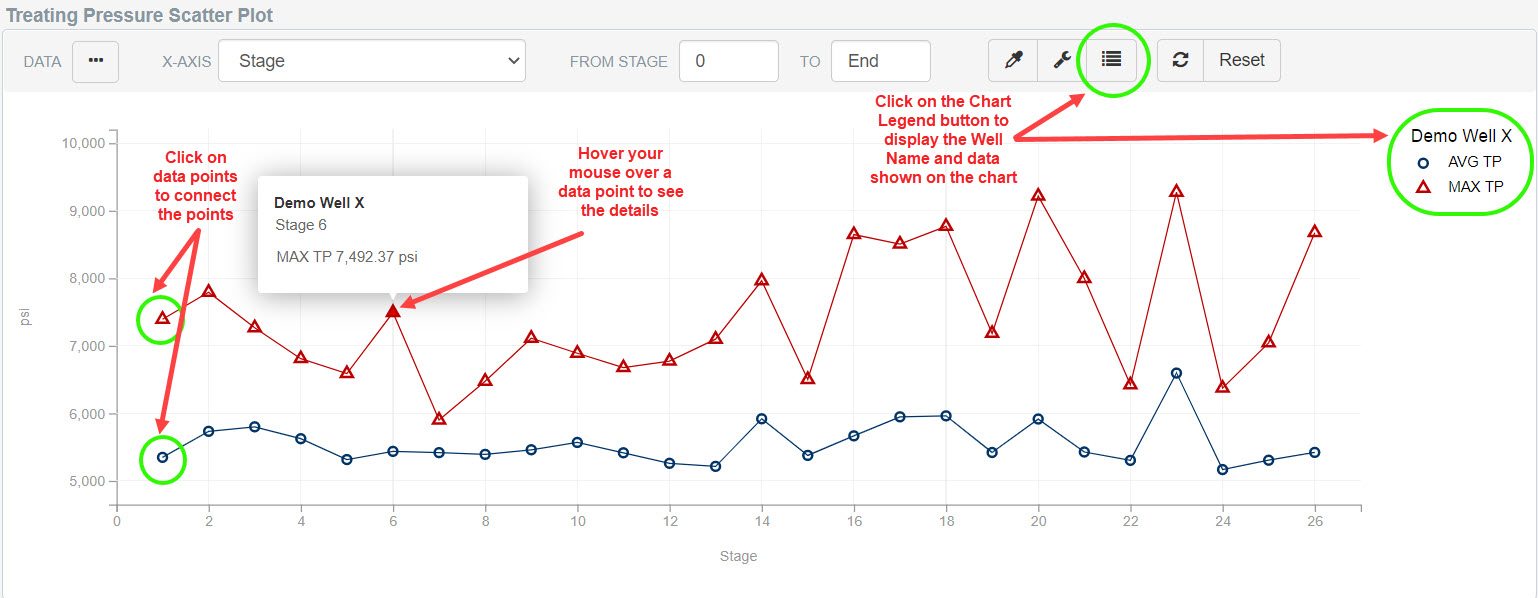
When the Scatter Plot displays, there are many options you can use to enhance the appearance. For example, click on a data point to connect the points, hover your mouse over any data point on the chart to see the details of that point and, click on the Chart Legend button to display the Well Name and names and colors of each data element on the chart.
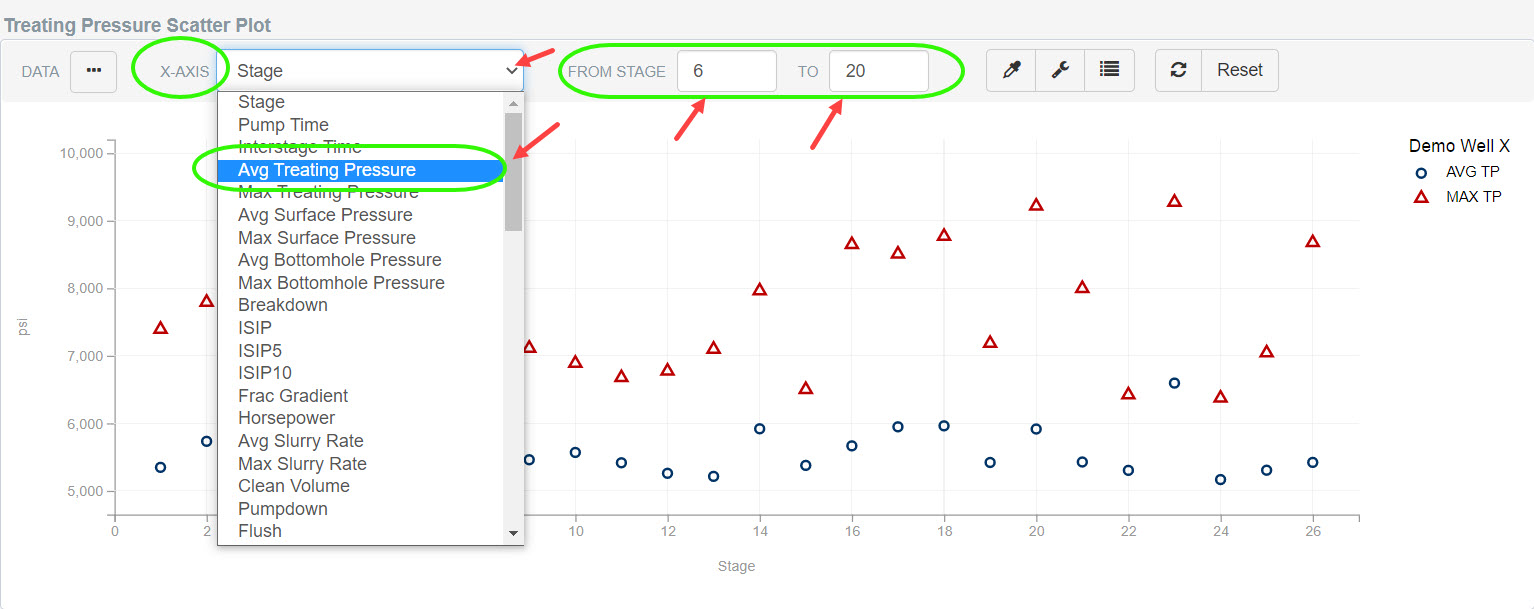
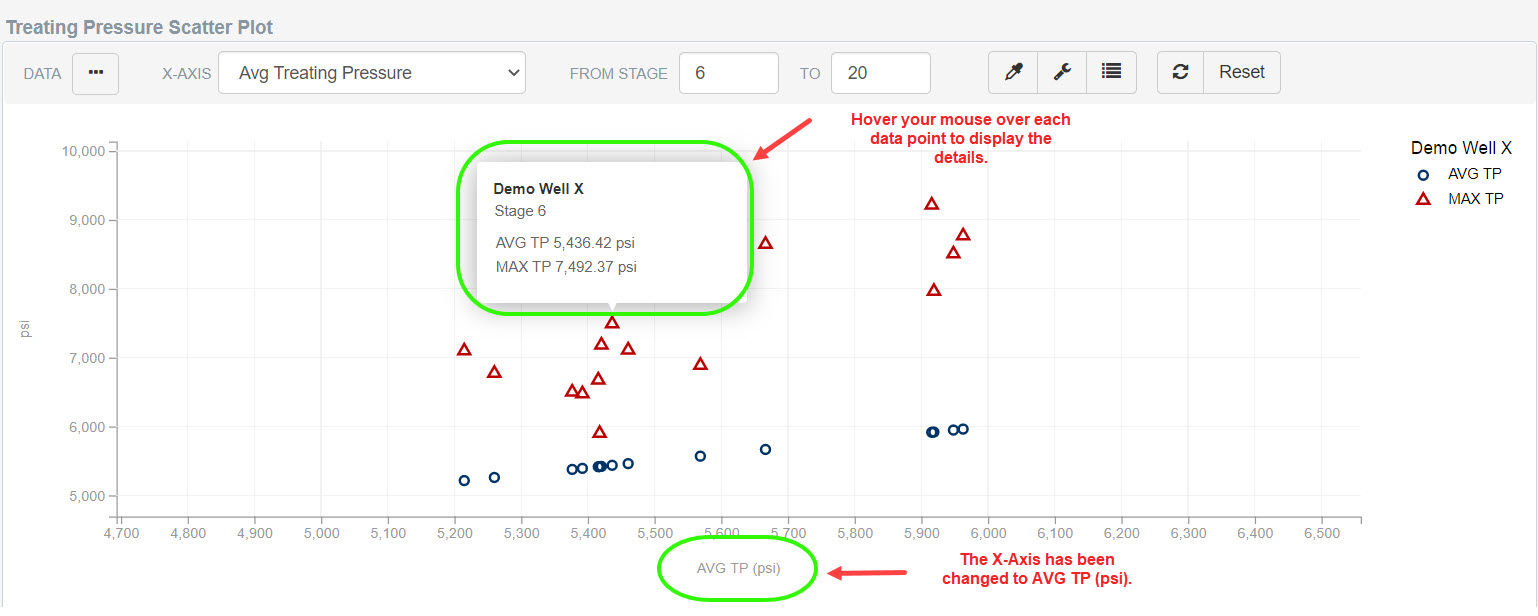
The default setting for the X-Axis is Stage. However, you can change the X-Axis by clicking on the down arrow next to X-Axis on the toolbar to select other elements. Easily change the stages that are displayed by typing in the From Stage and To Stage numbers.
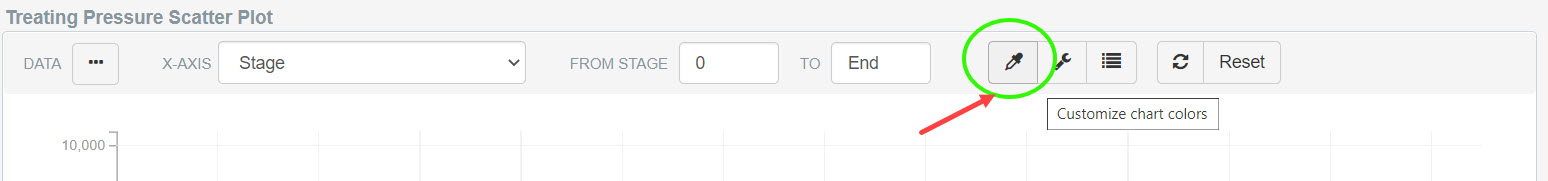
Change your chart colors by clicking on the Customize chart colors button.
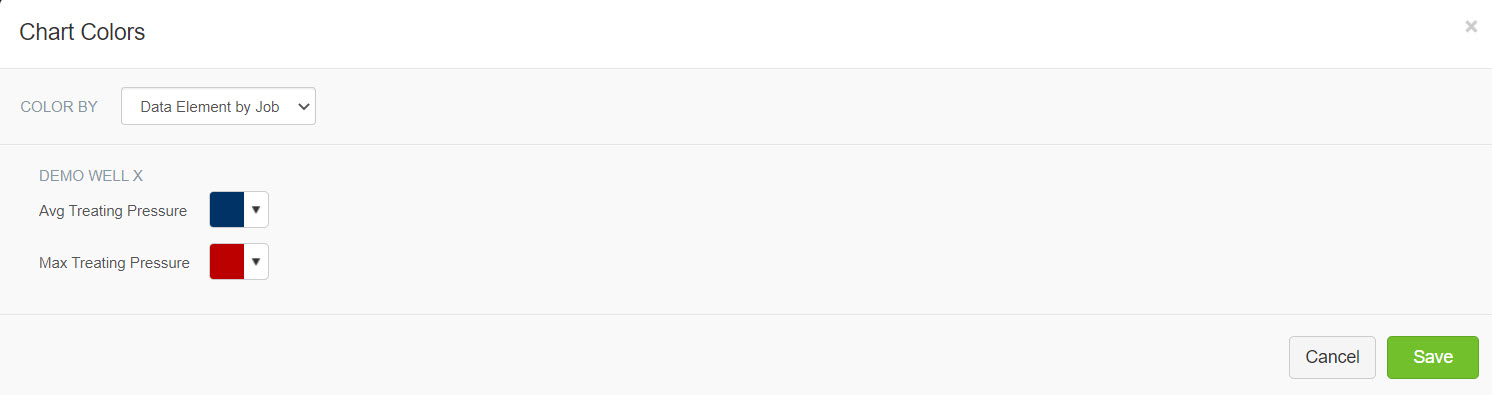
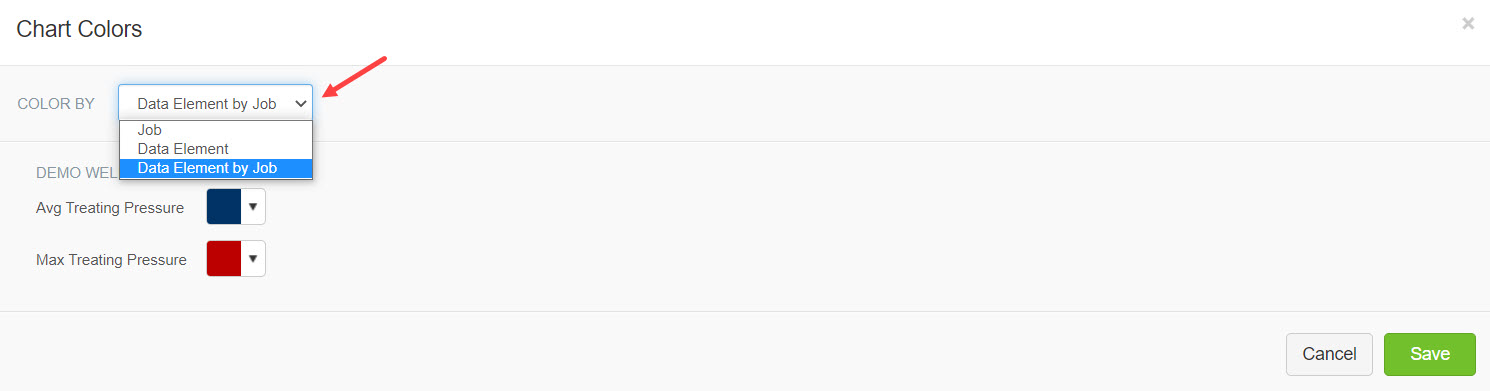
By clicking on the drop-down next to Color By, you can choose either Job, Data Element or Data Element by Job.
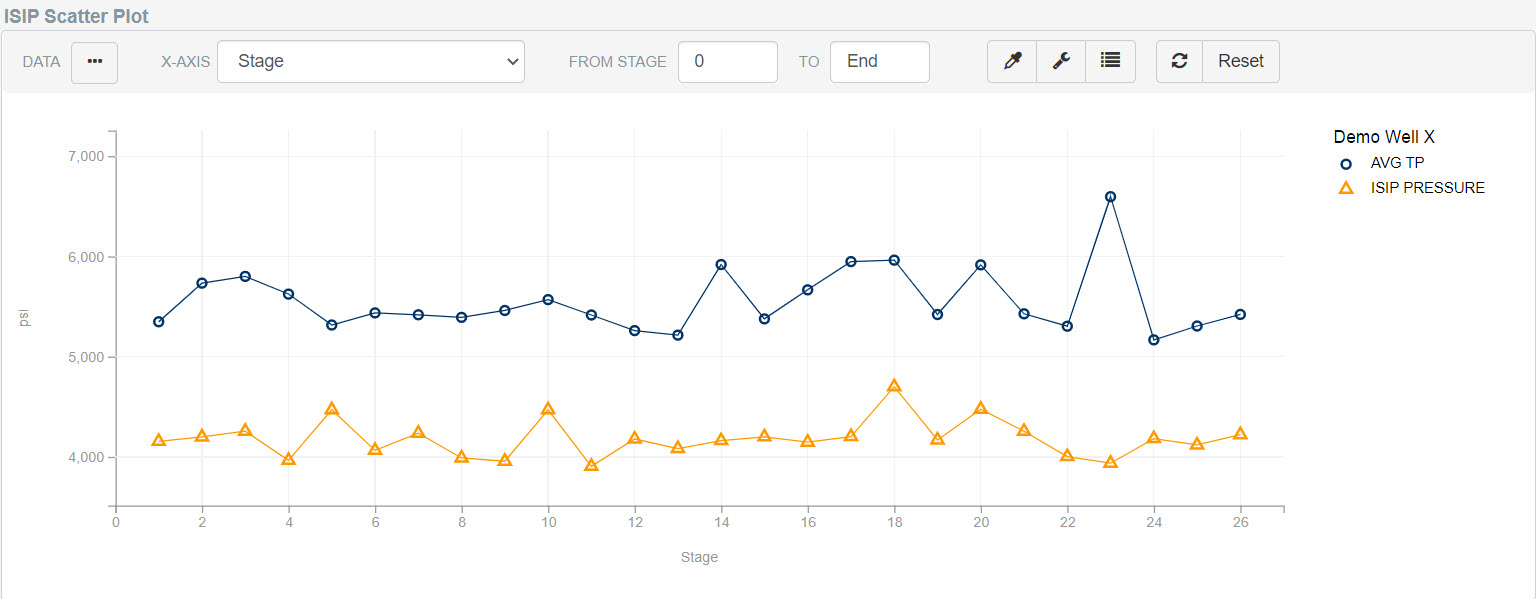
ISIP Scatter Plot:
Directly below the Treating Pressure Scatter Plot, you will see an ISIP Scatter Plot. It has the same functionality as the Treating Pressure plot where you an easily customize the appearance.
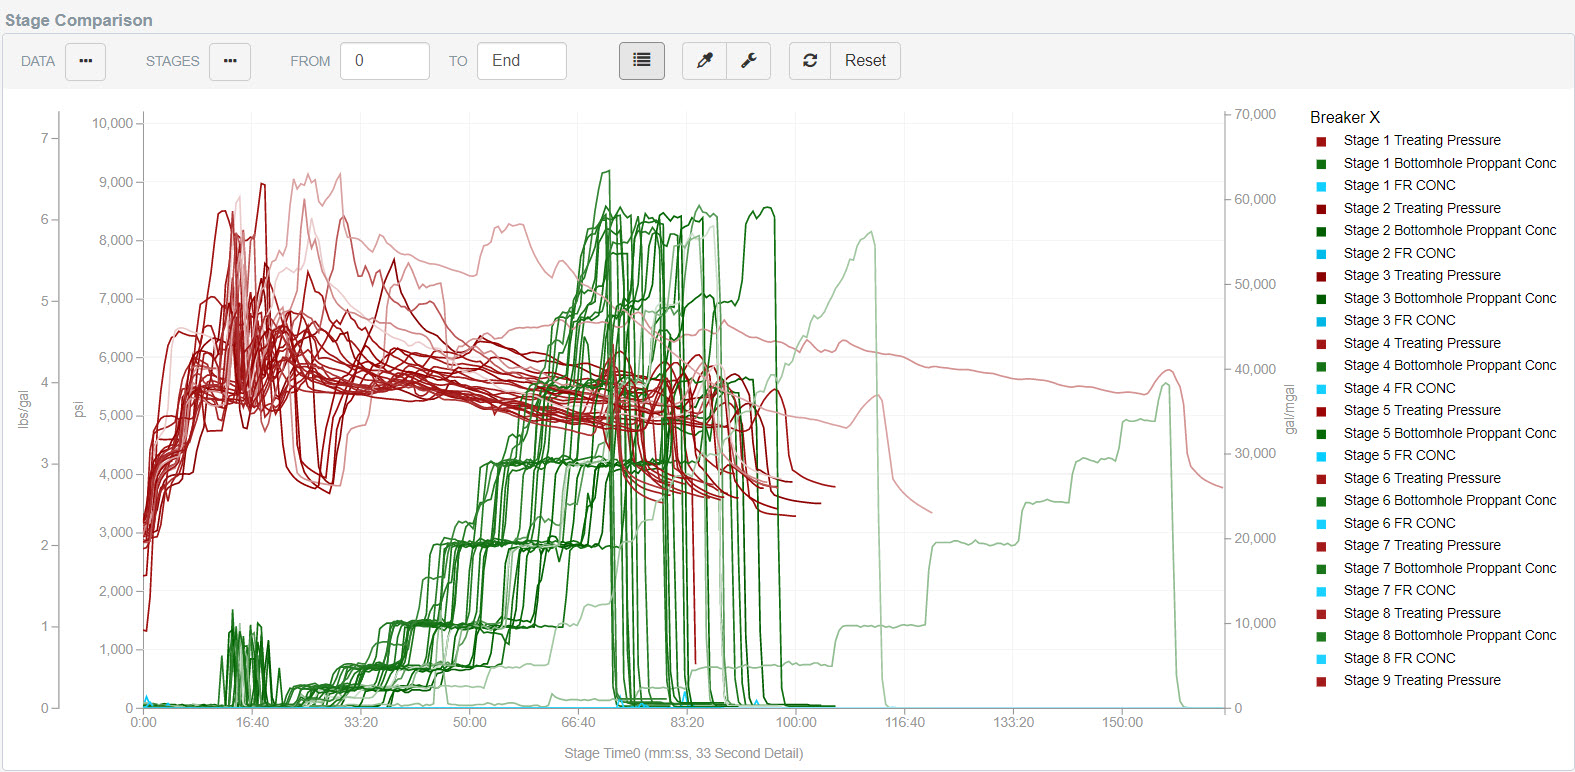
Treating Pressure Stage Comparison:
Scroll down below the ISIP Scatter Plot and you can easily narrow in on a few stages or you can select to see all stages using the Treating Pressure Stage Comparison chart.
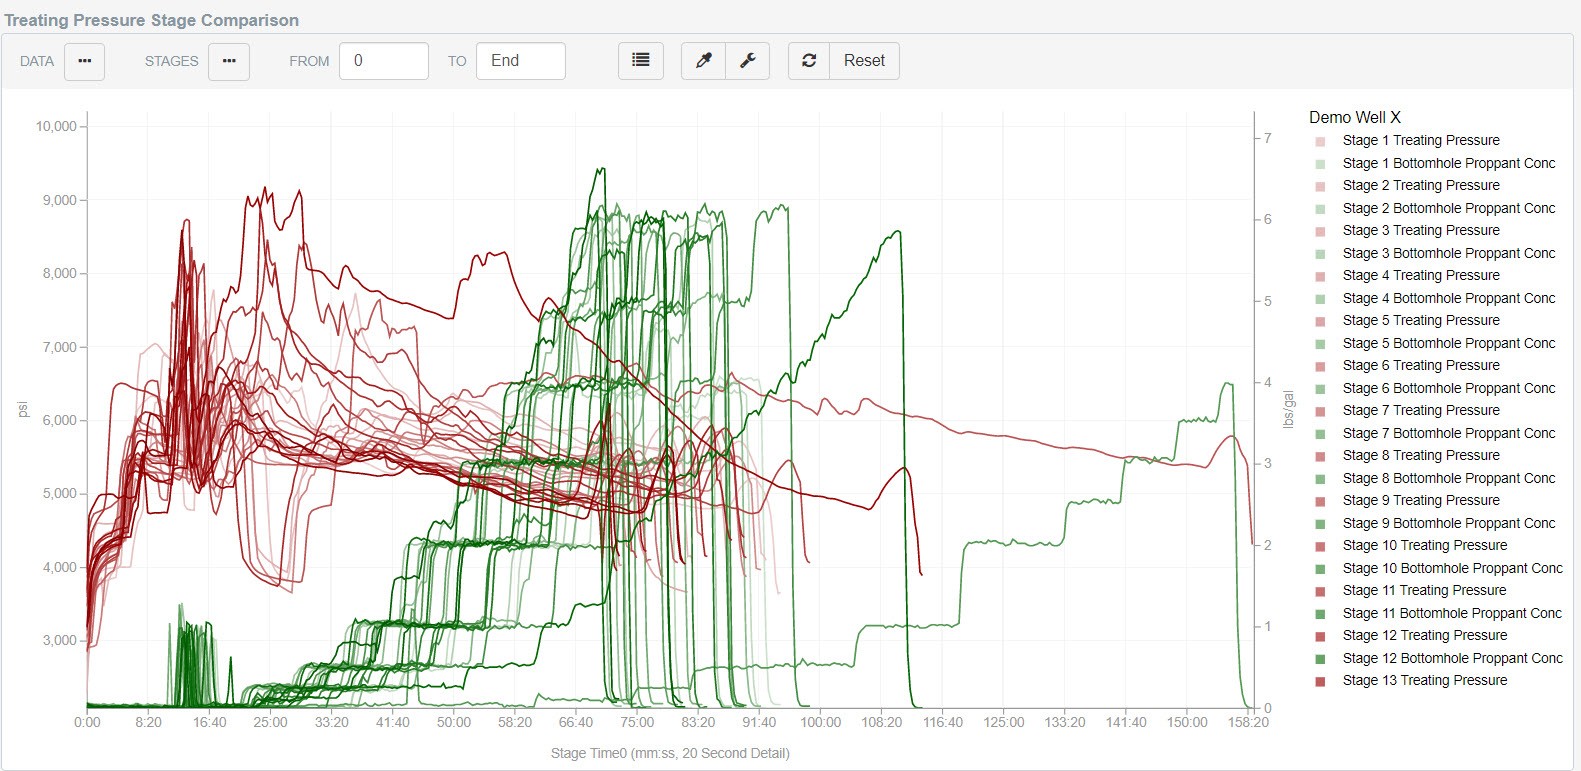
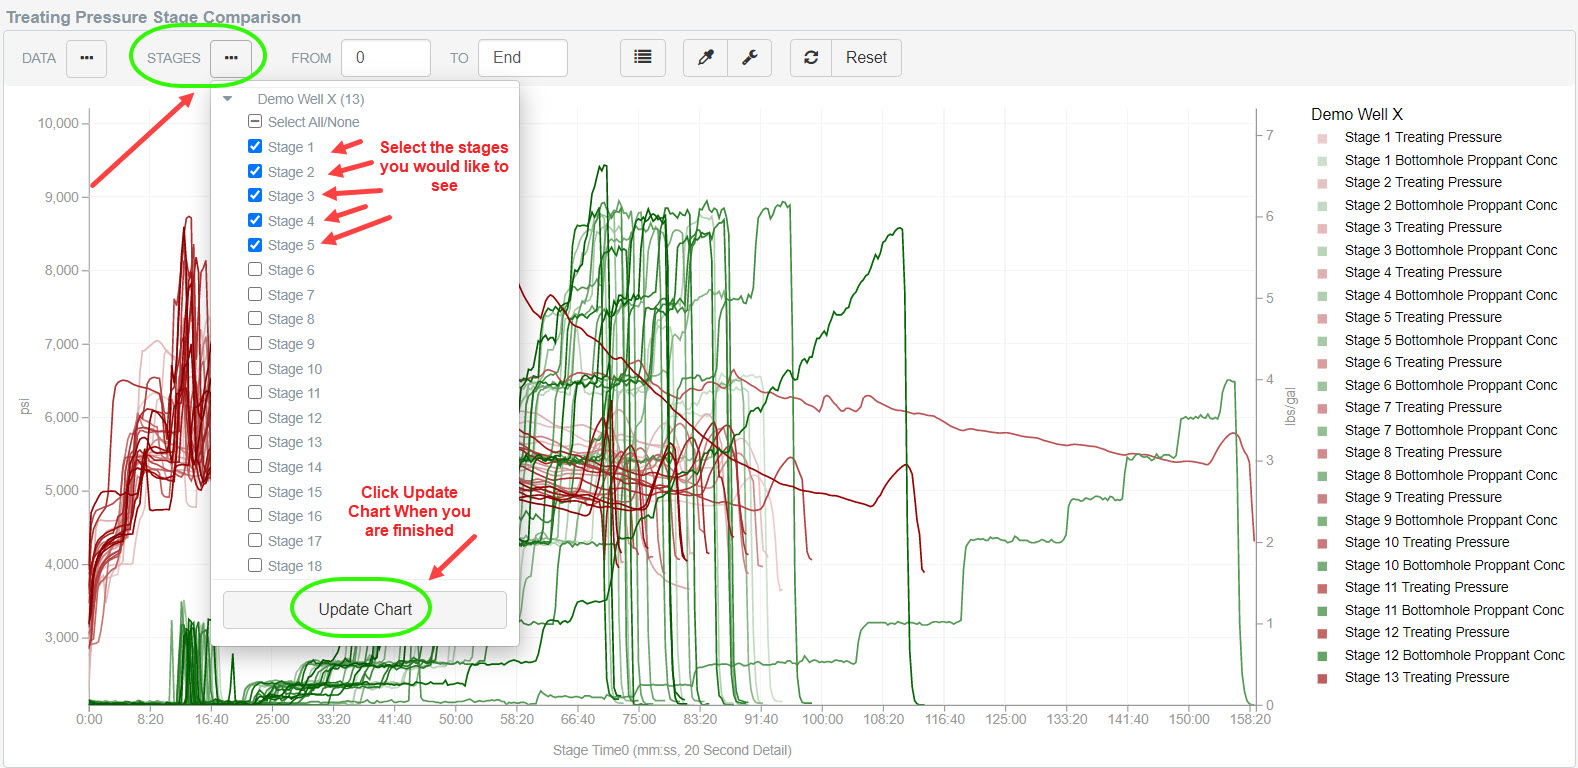
The only functionality on this chart that is different from the Scatter Plots previously mentioned, is the Stages 3-dot button on the toolbar. Click the button and select the stages you would like to see on the chart. Click Update Chart when you are finished.
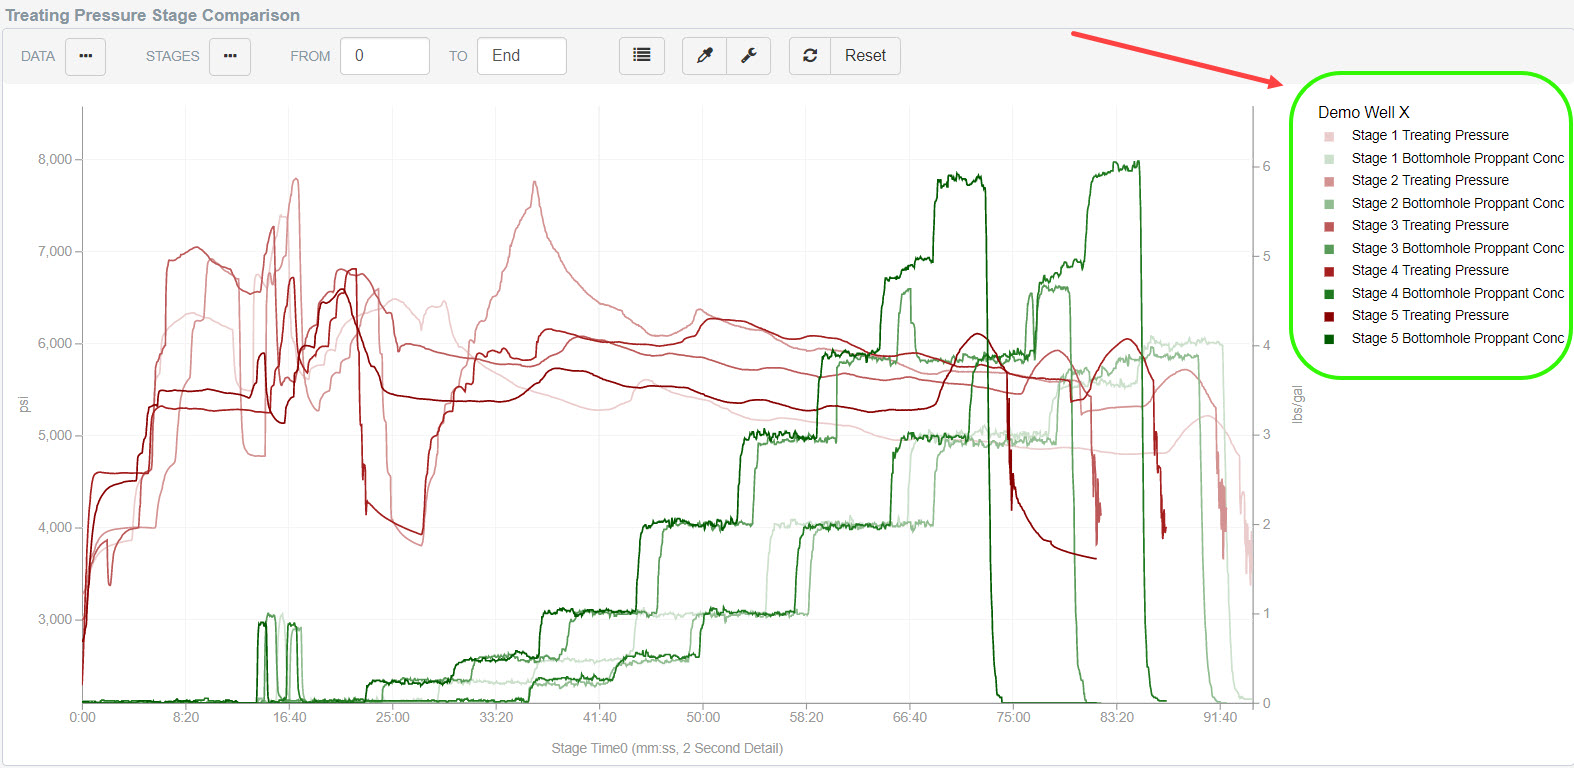
Notice the updated stages on the chart.
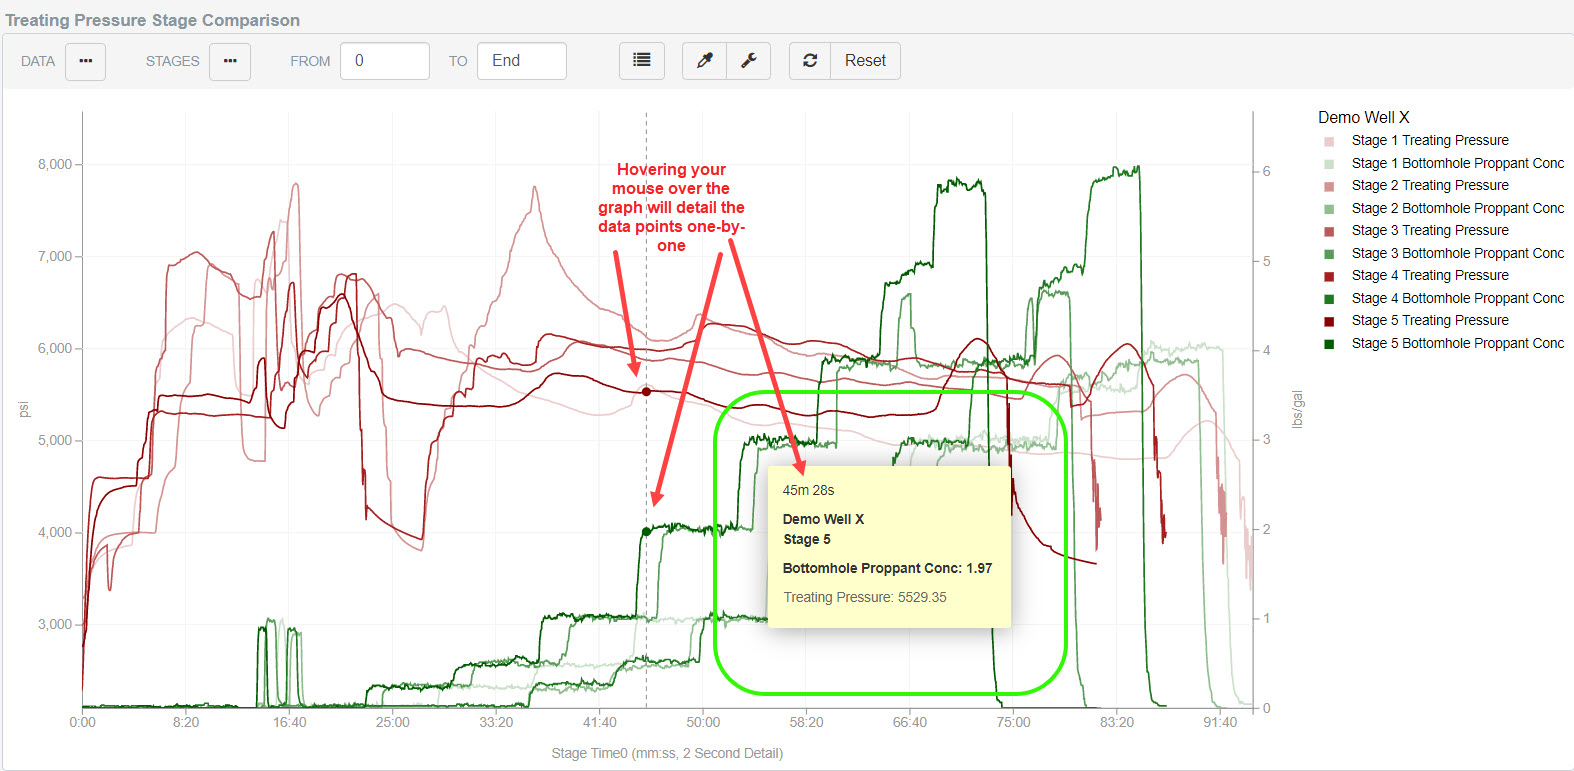
Hovering your mouse over the chart will display a dotted tracking line and a popup tooltip to detail the data points one by one.
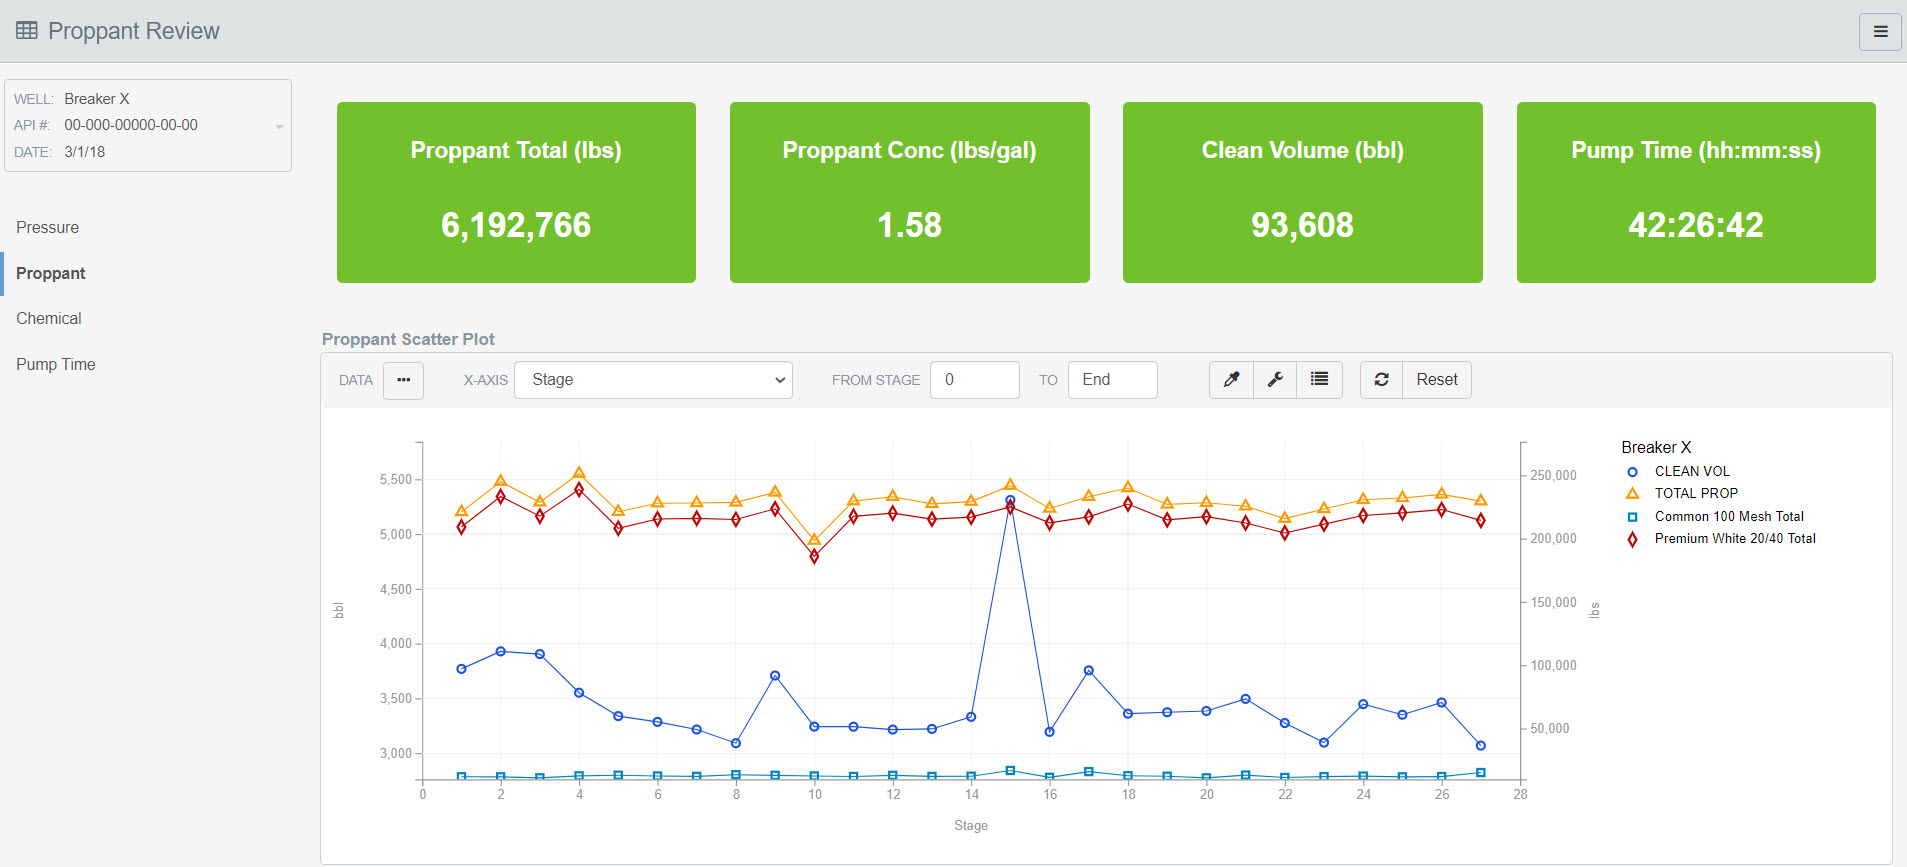
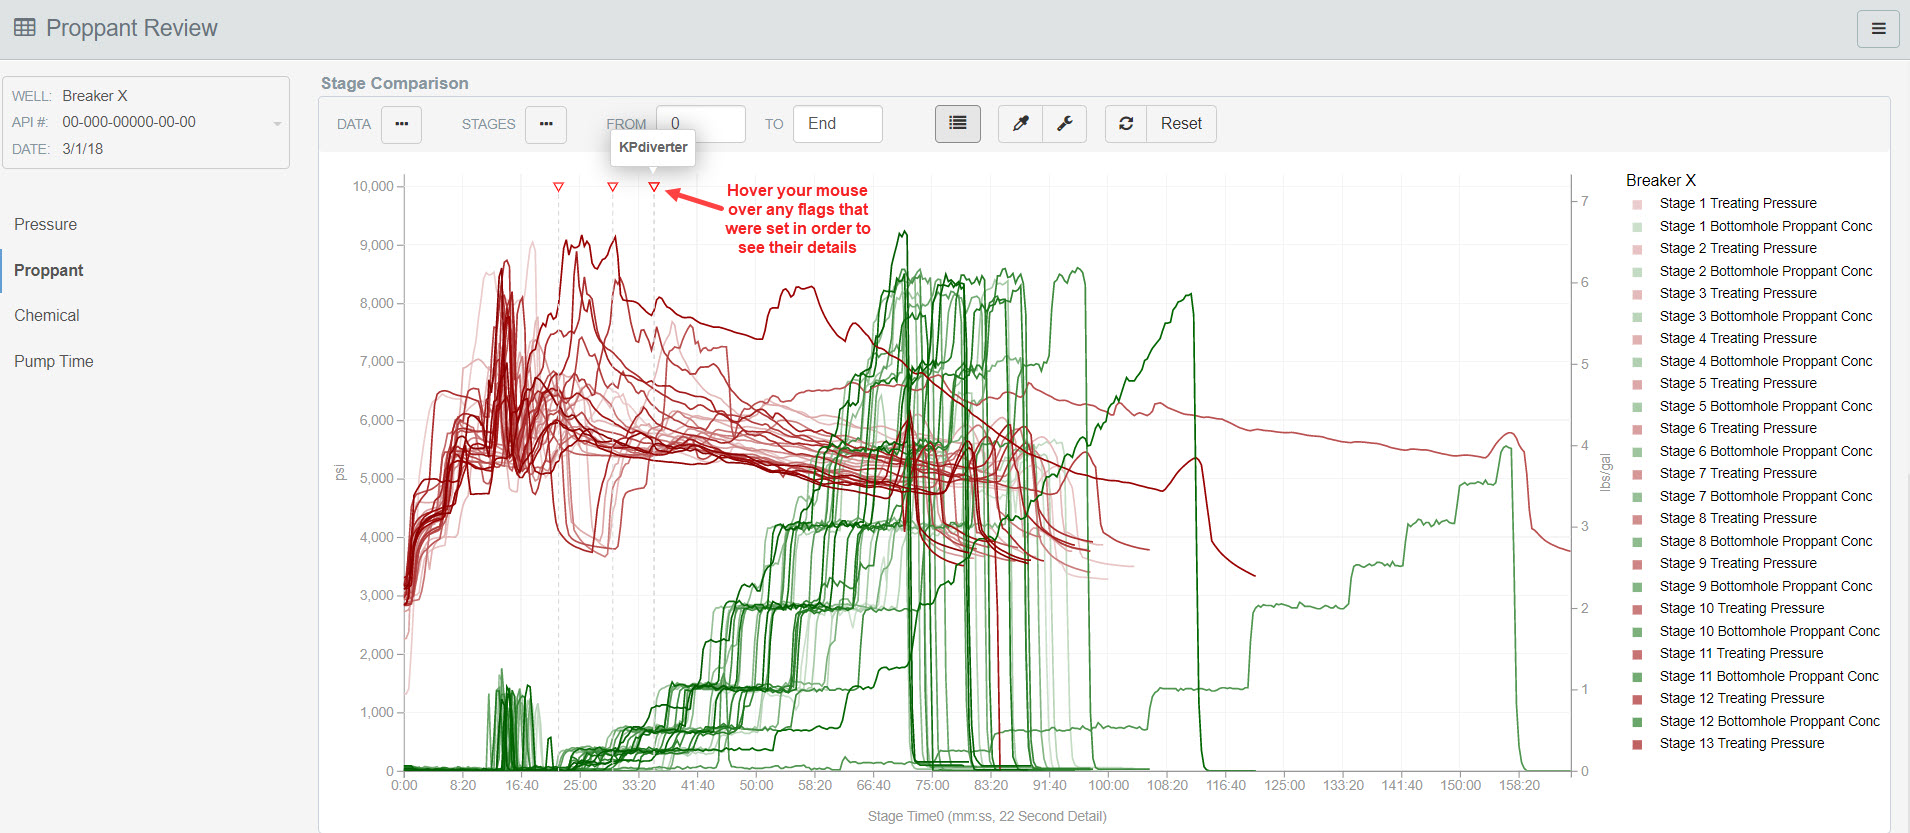
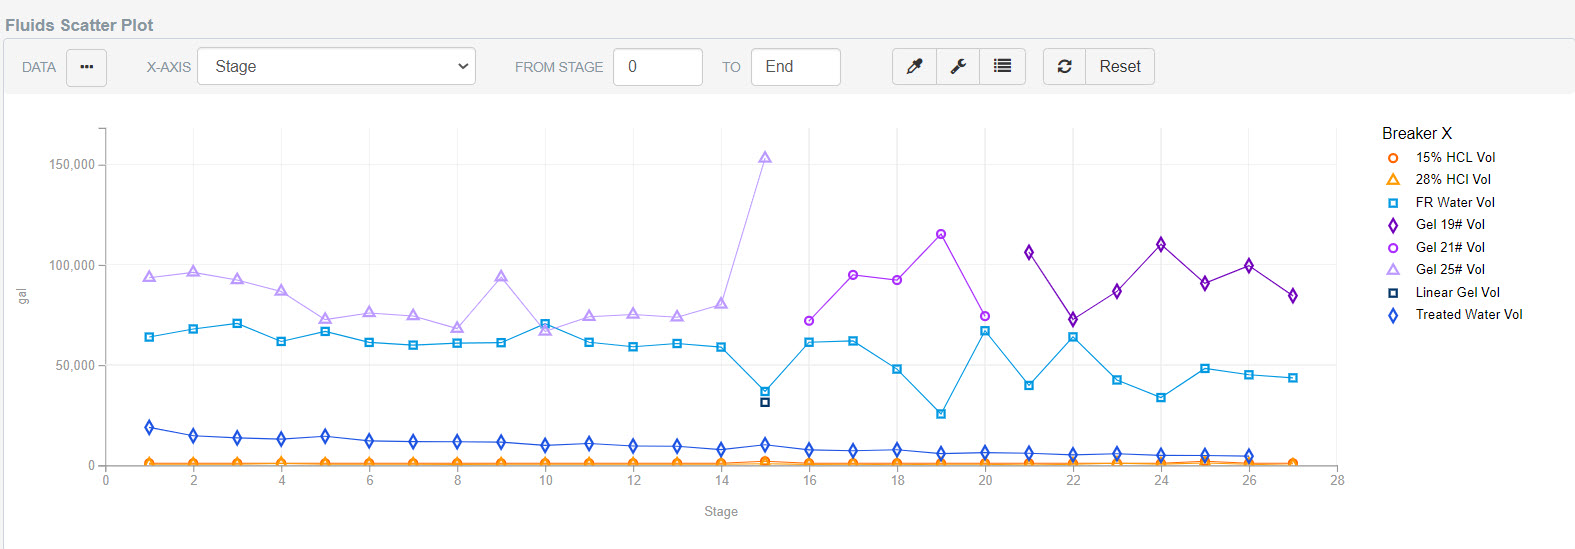
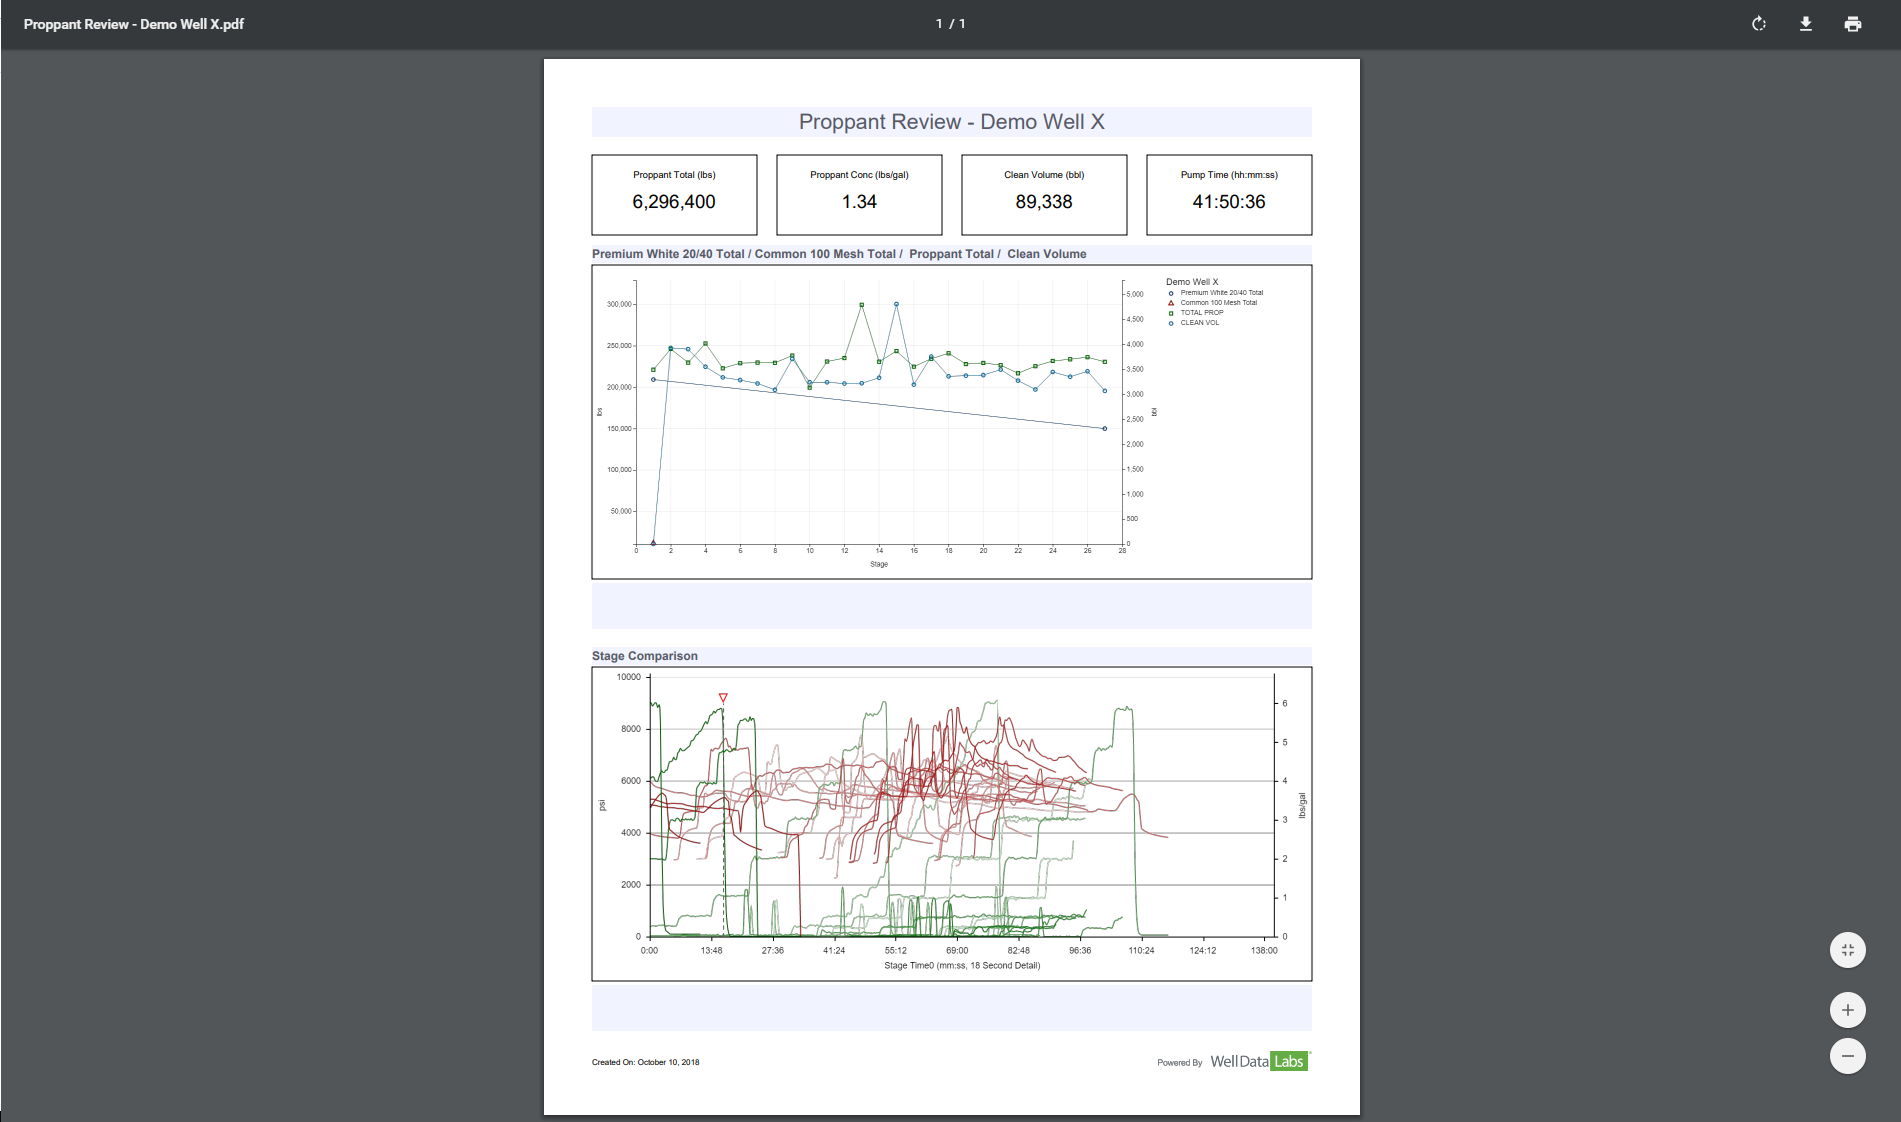
Proppant Review:
In addition to the Proppant Scatter Plot and the Stage Comparison, the Proppant Review displays the Proppant Total, Proppant Concentration, Clean Volume and the Pump Time for your selected well – all at the top of the page. In addition, a Proppant Scatter Plot and a Stage Comparison chart can be found below.
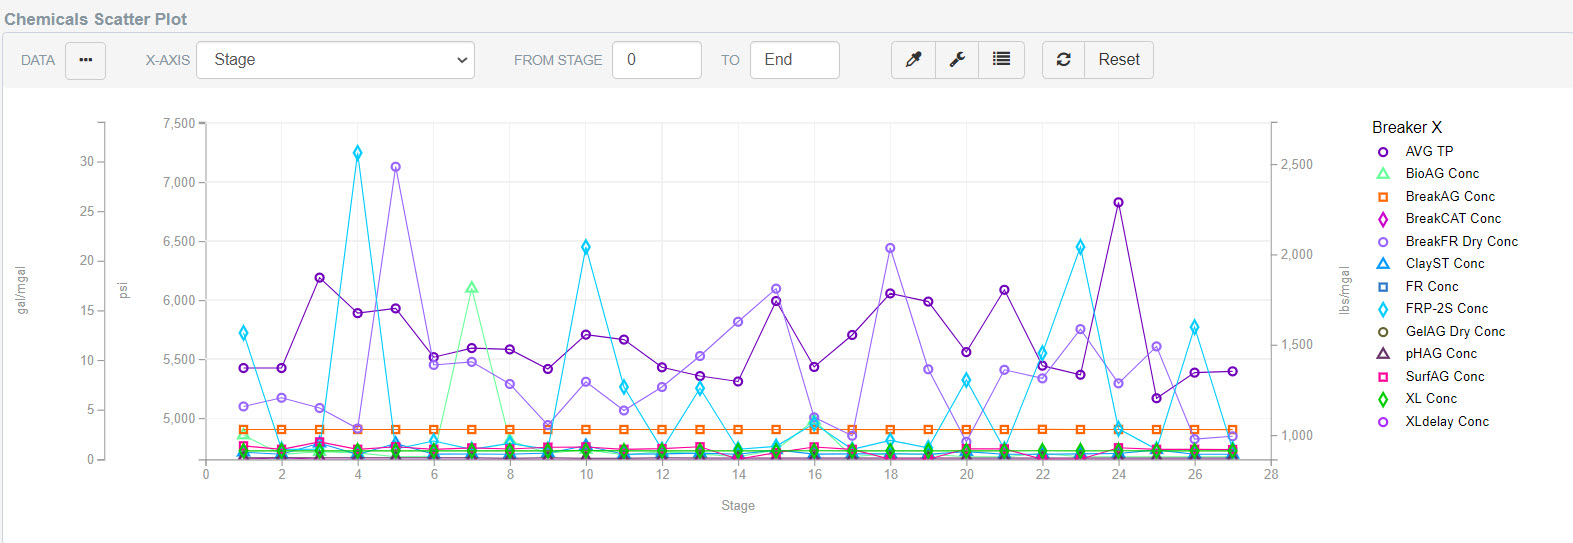
Chemicals Review:
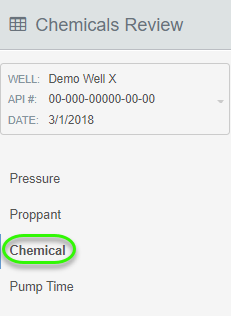
Chemicals Review is where you can take a look at your Fluids and Chemicals as well as a Stage Comparison to see where your Treating Pressure has been affected by chemical usage.
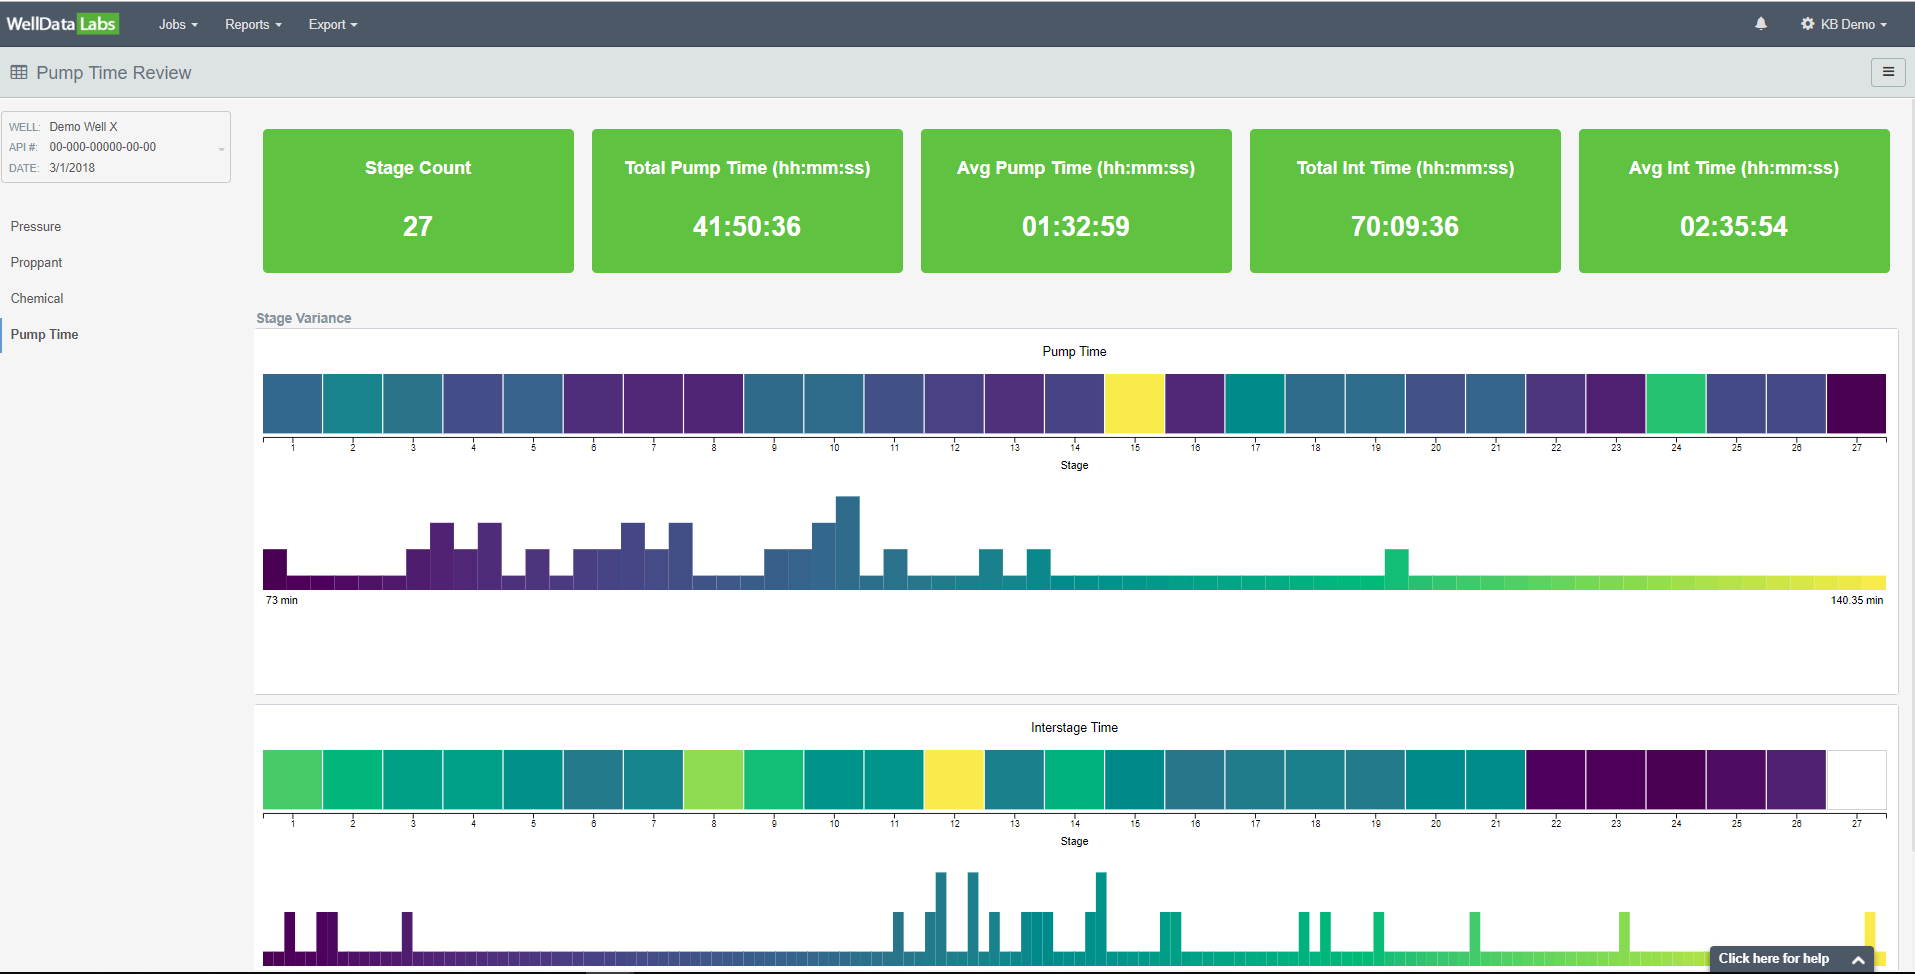
Pump Time Review:
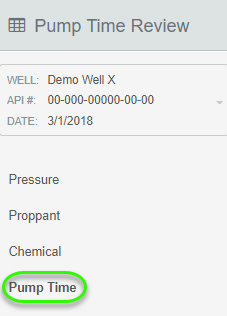
The Pump Time Review gives you a quick look at any Stage Variances for your Pump and Interstage Times.
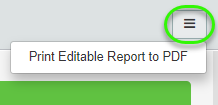
Print PDF:
All of the reports can be printed to an editable PDF by clicking on the 3-bar button in the upper right-hand corner of each page and selecting Print Editable Report to PDF.
There are a lot of graph features and customization options in Well Data Labs; learn more about them in the Graph Features article. If you would like to learn more about using Well Data Labs Scatter Plots and Stage Comparison, click on the links and take a look!