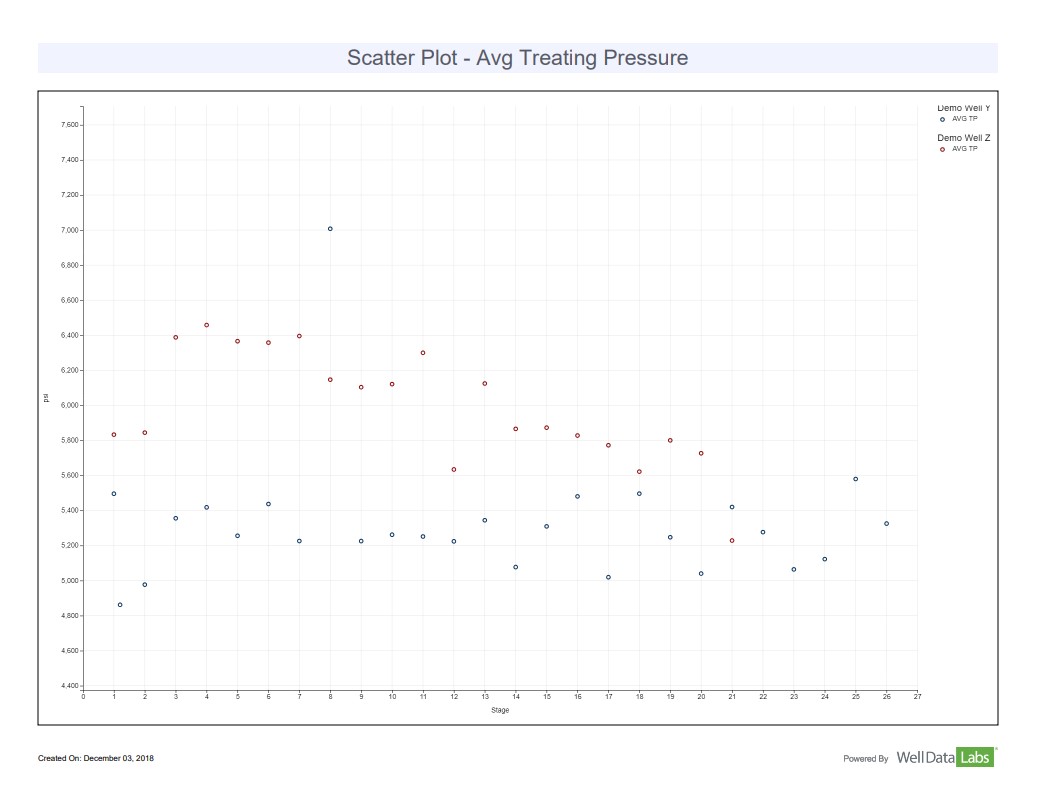
For comparing aggregated data elements against each other, you'll want the Scatter Plot Report. You can quickly select all of the data elements that you want to see plotted. And with Cross Plotting, we make it easy to plot data types against one another.
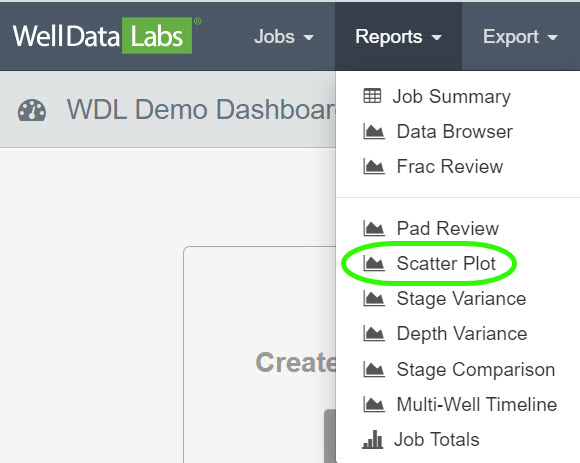
To access the Scatter Plot, click the reports drop-down on the toolbar and select Scatter Plot.
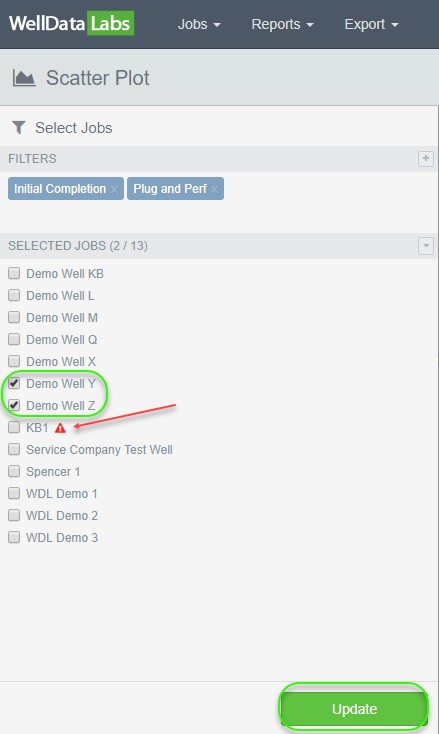
When the Scatter Plot window opens, you will be able to filter the Jobs that you would like to take a look at.
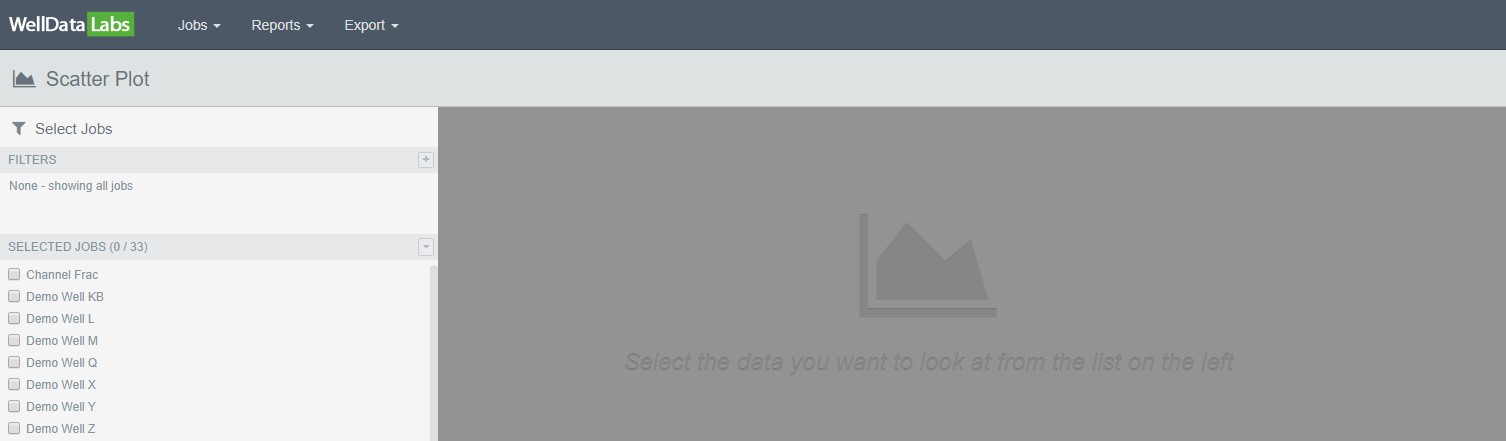
Begin by building out a Filter set to narrow down the list of Jobs to select from. Click the plus sign next to Filters, then click the arrow to expand the available criteria for each element. As you select filters, you'll see the Selected Jobs list change to contain only those Jobs that match any of the filters you have selected. When you've completed selecting the filters you want, click the "X" or the "+" Icon again to hide the window. Your selected filters will be shown as blue boxes.
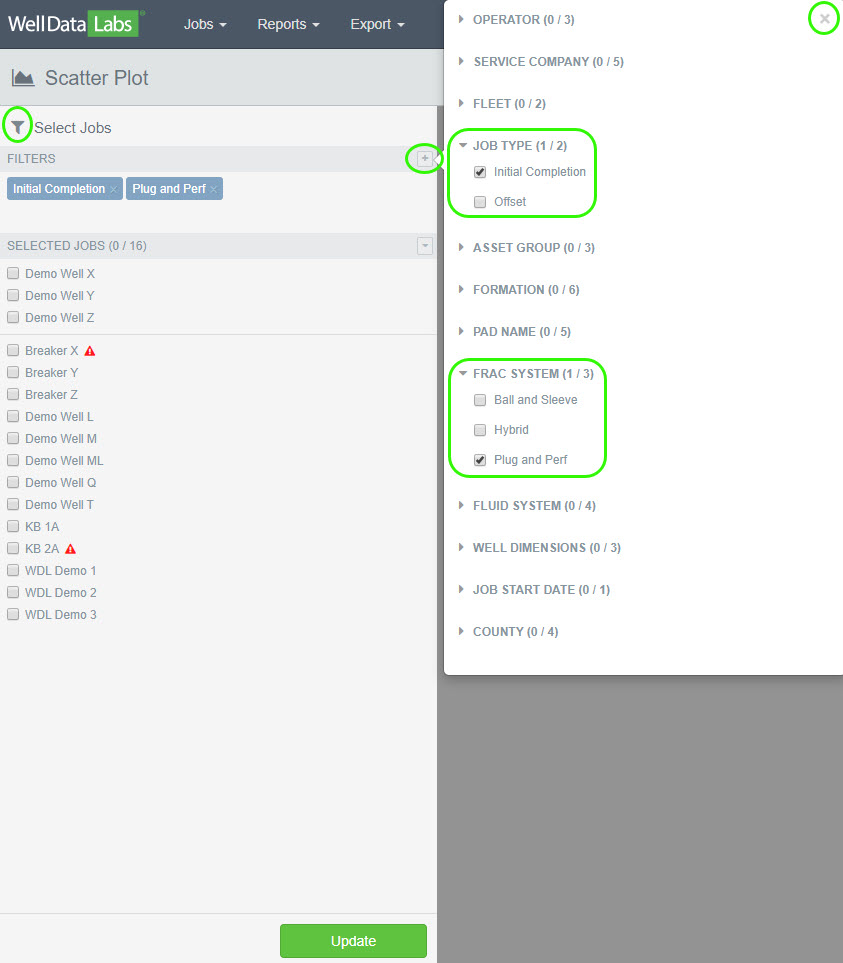
Once you have selected your Filters, choose the Jobs that you would like to see and click Update.
Note: If the job is missing Stage Start and Stage End times, a red warning triangle will appear next to the job in the Selected Jobs list. You can click on the triangle to jump to the Stage Mappings page for that job.
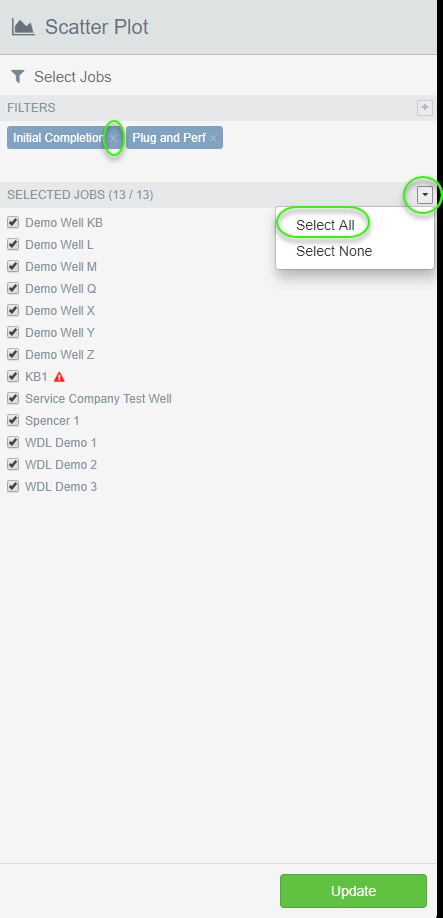
You can use the "built-in default actions" to quickly Select All the jobs or to Select None of the jobs. The default actions are under the drop-down arrow on the Selected Jobs title bar. To remove a filter, just click on the small "X" inside of the filter's blue box to make it disappear. The Selected Jobs list will instantly update to reflect the changes.
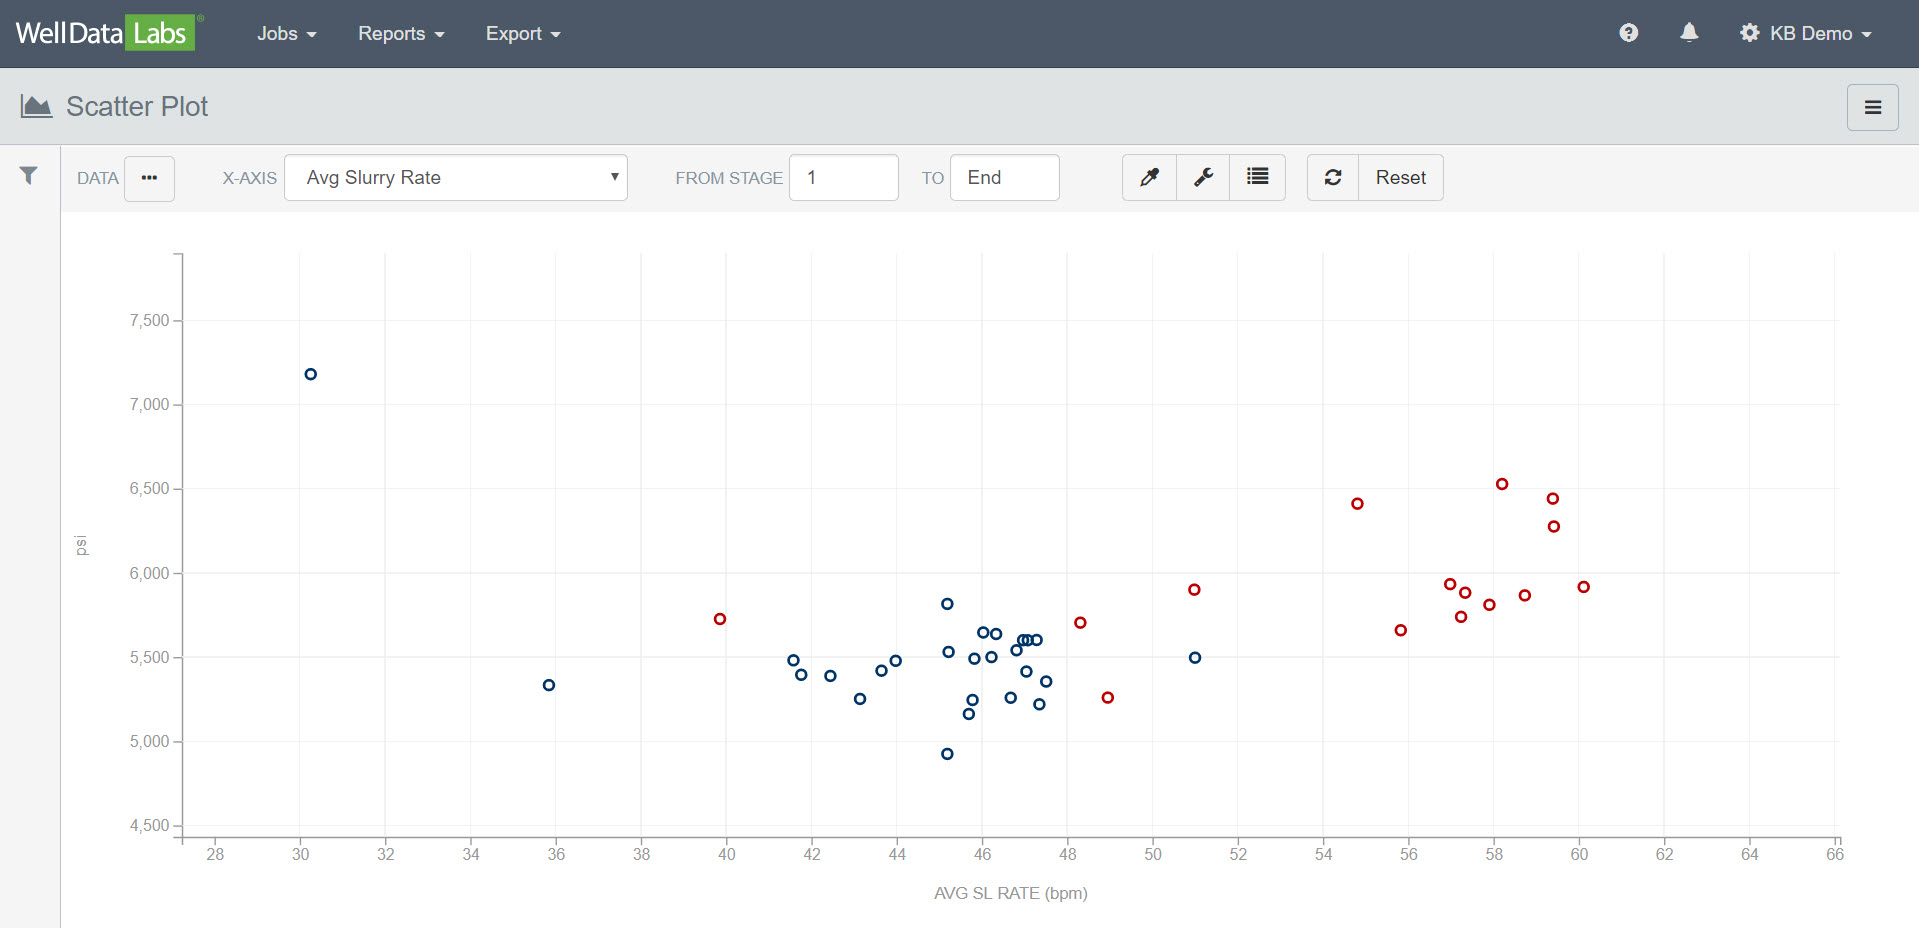
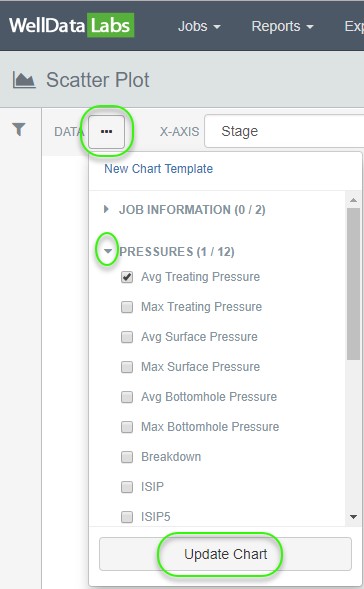
Once you have selected your Jobs the next step is to select the Data Channels you would like to see on the chart. Click the 3-dot button located in the upper left-hand corner of the toolbar. Select the data elements you would like and click Update Chart when you are finished.
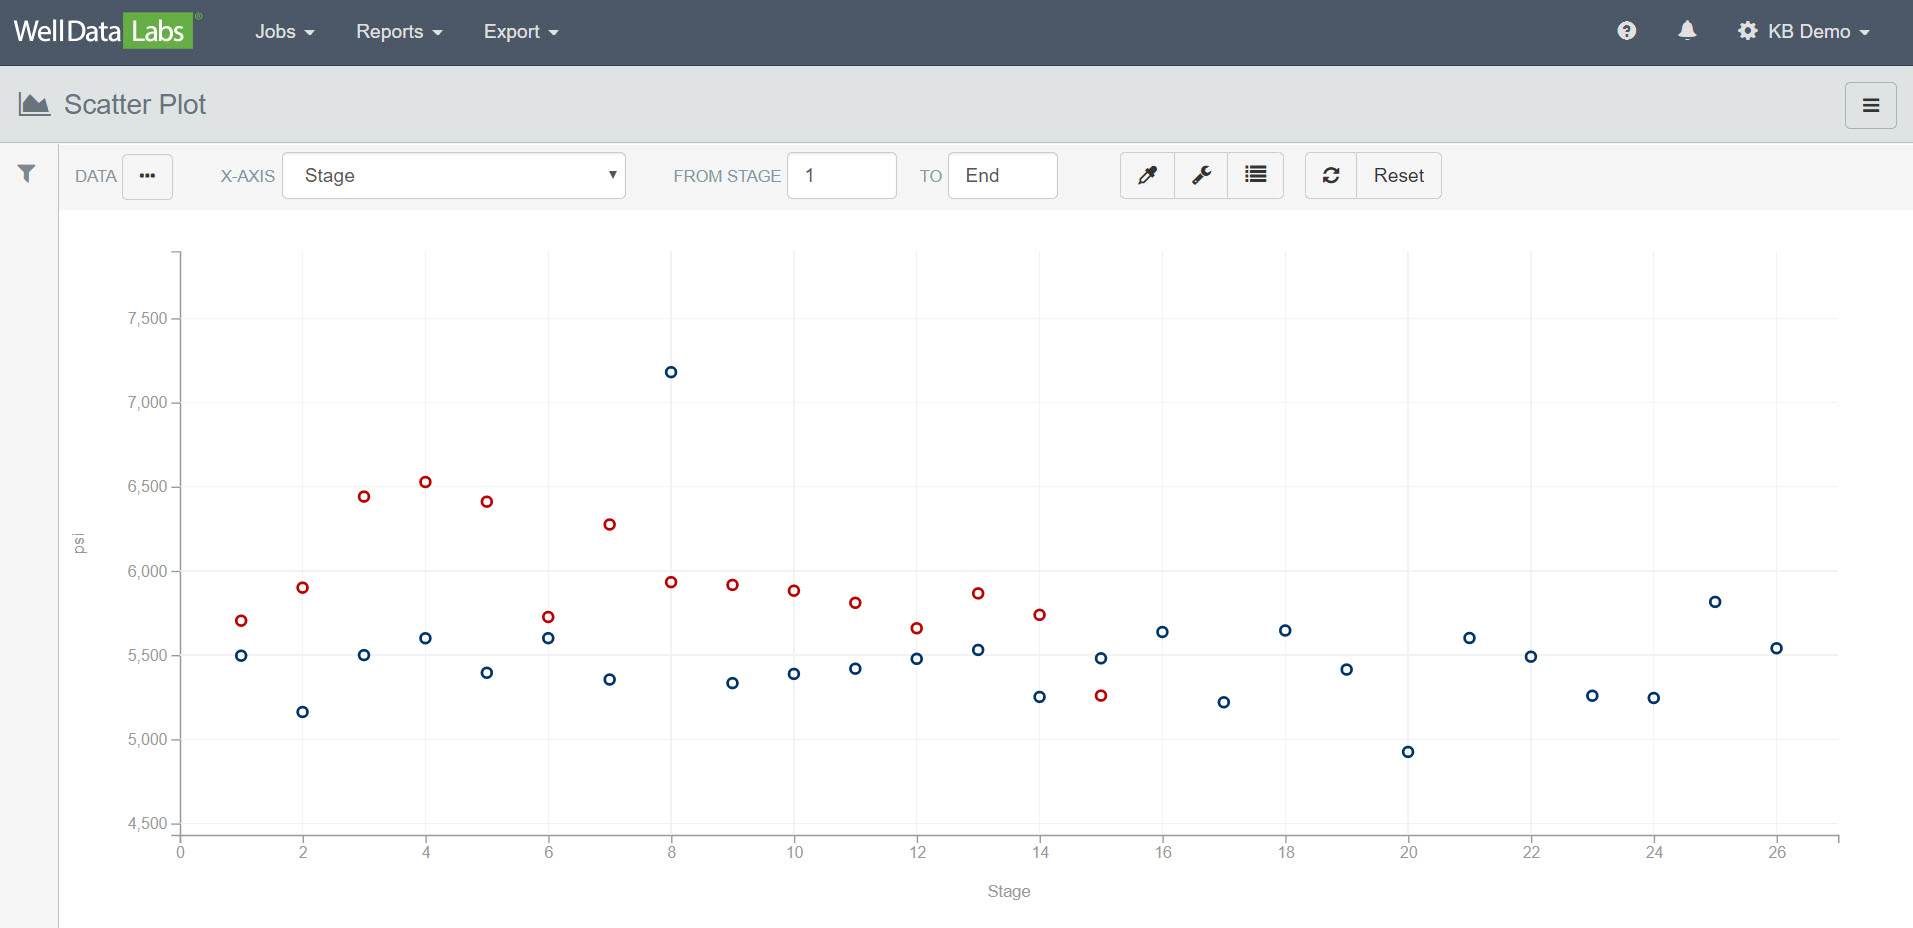
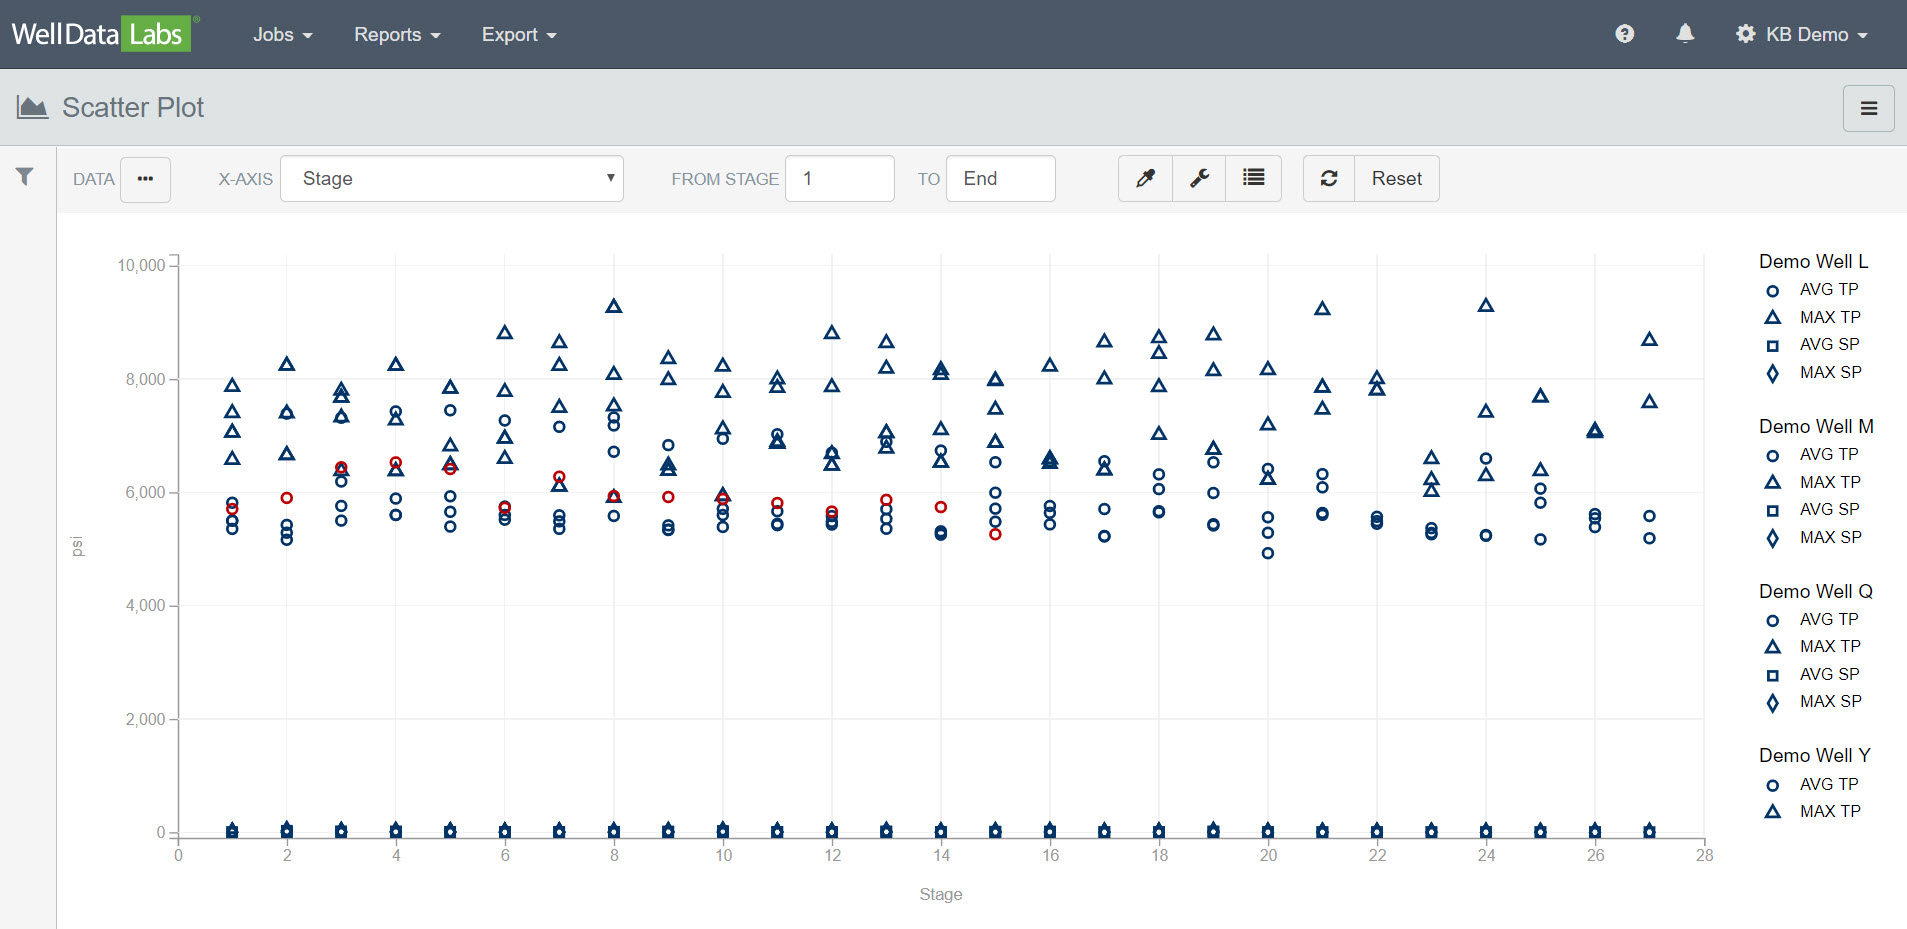
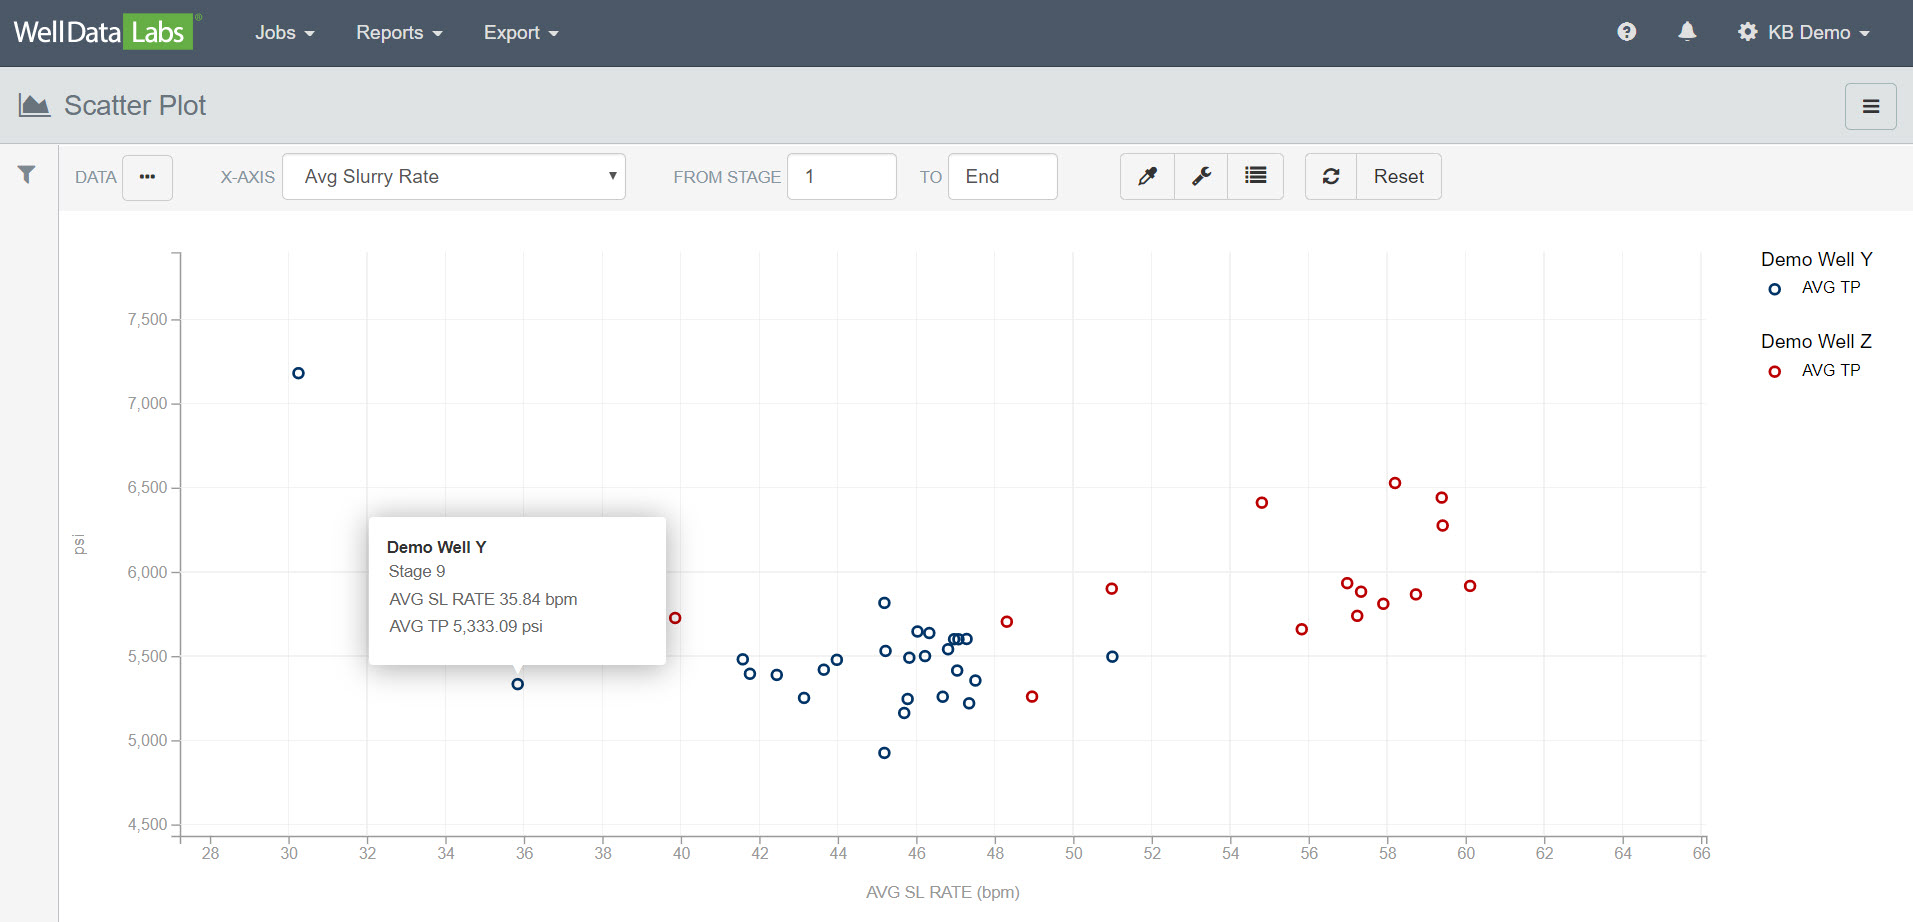
Easily turn the Chart Legend On and Off by clicking on the Chart Legend button on the toolbar. A great way to pick out your data from a busy graph is to click on one of the points in the series to turn on a connecting line. Notice when you hover over a point in a connecting line, the value for that point will display.
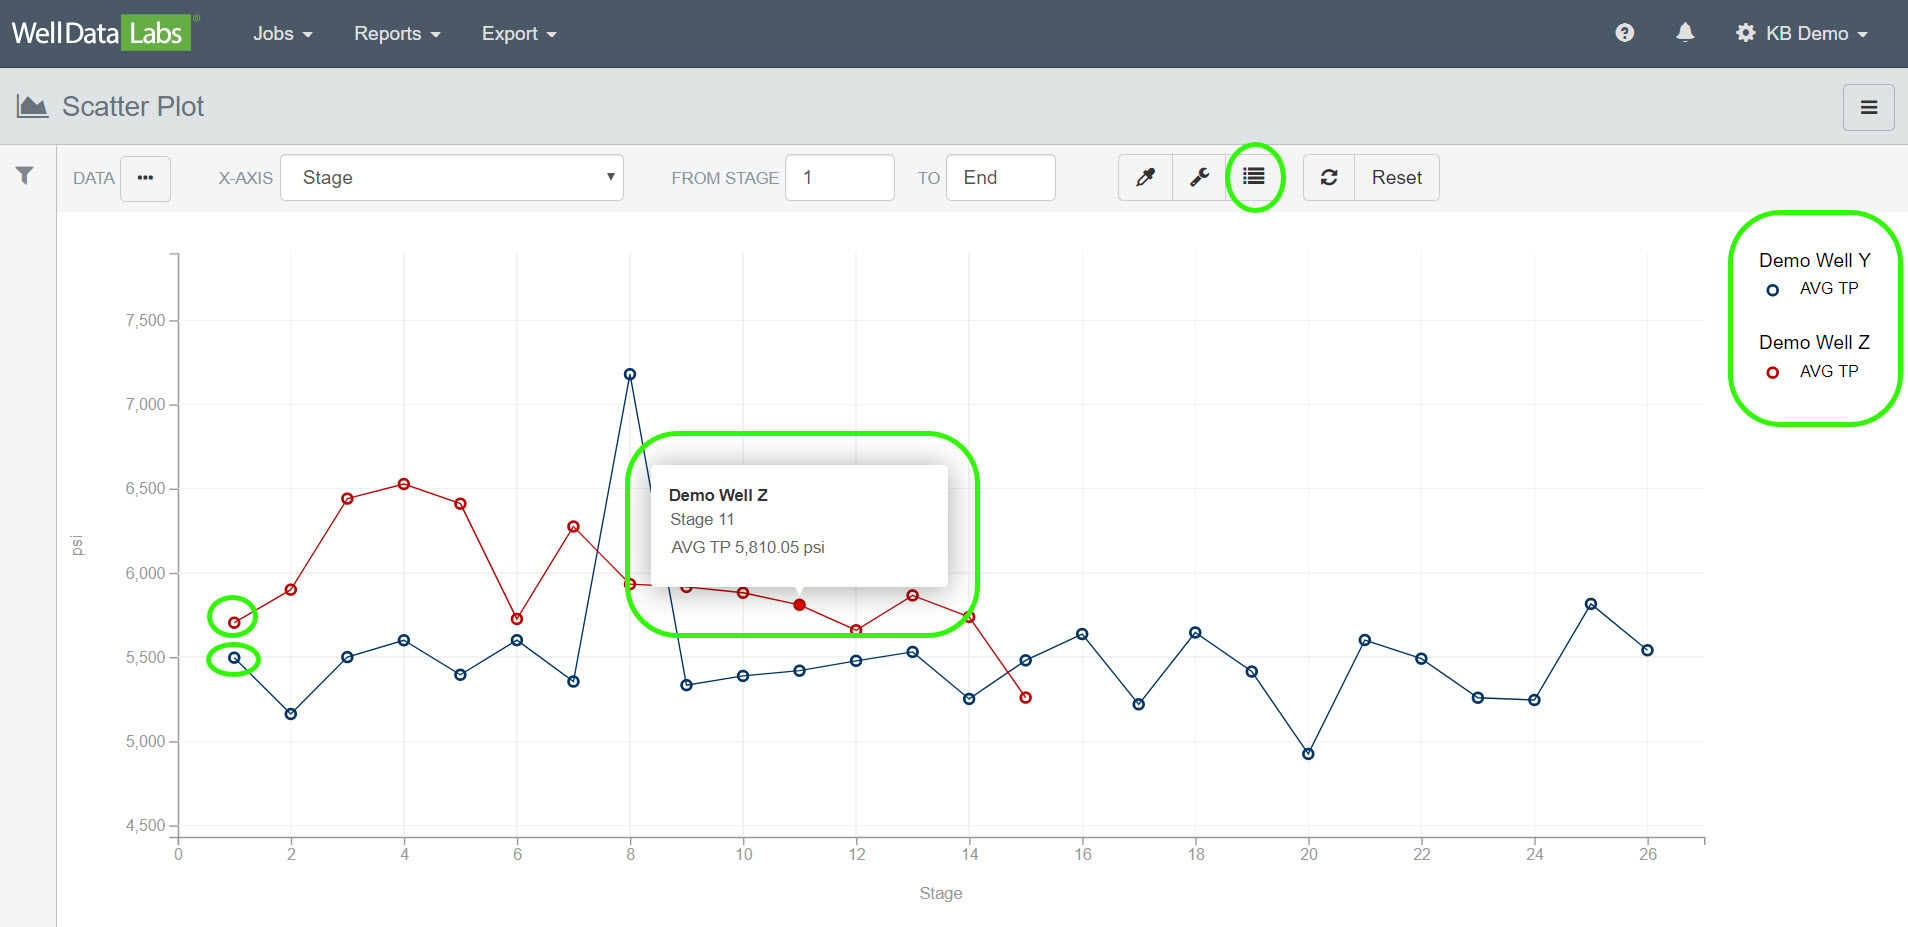
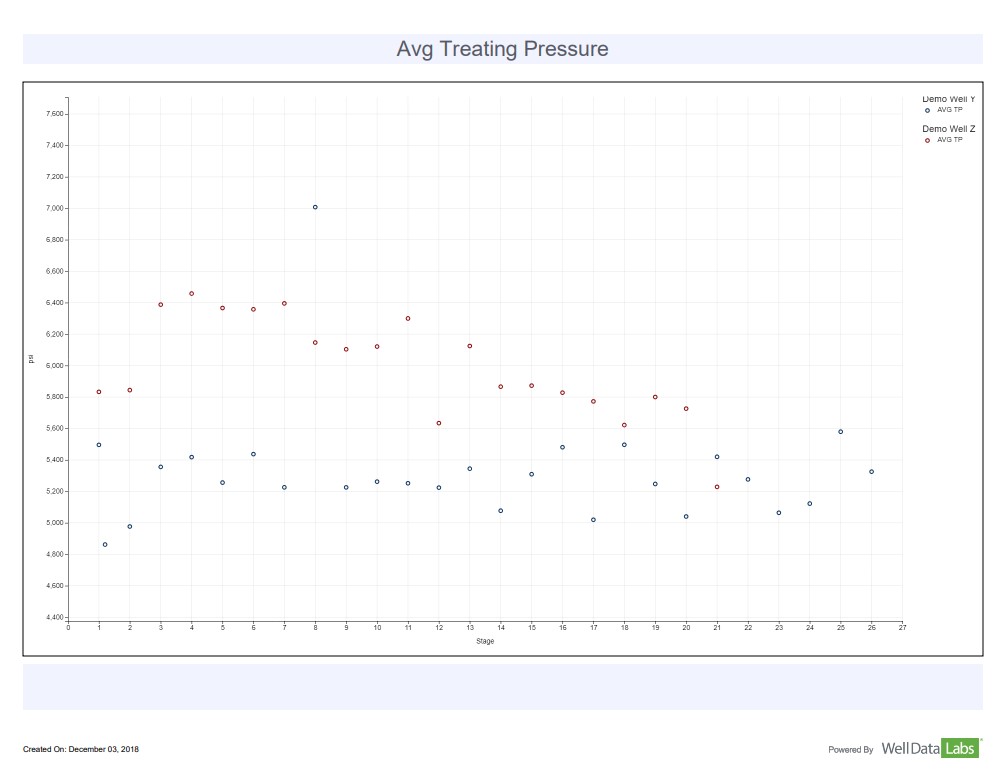
The Chart Options button on the toolbar allows for custom setting the Y-AXIS Scale and checkboxes for turning the connecting lines on and off and displaying all data sources.
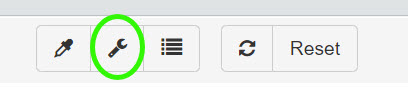
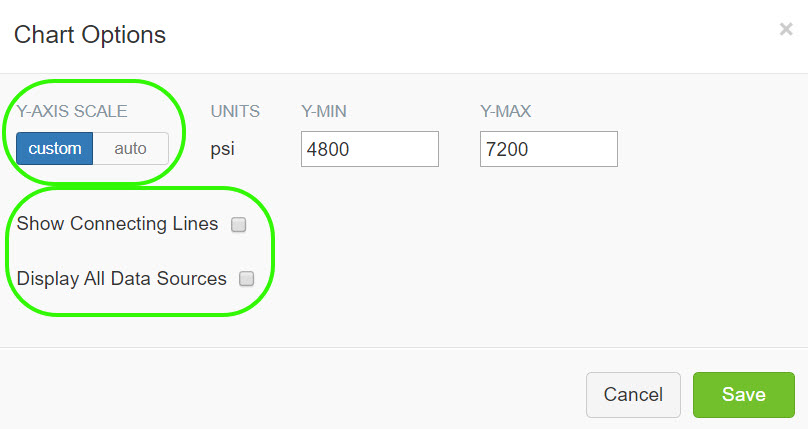
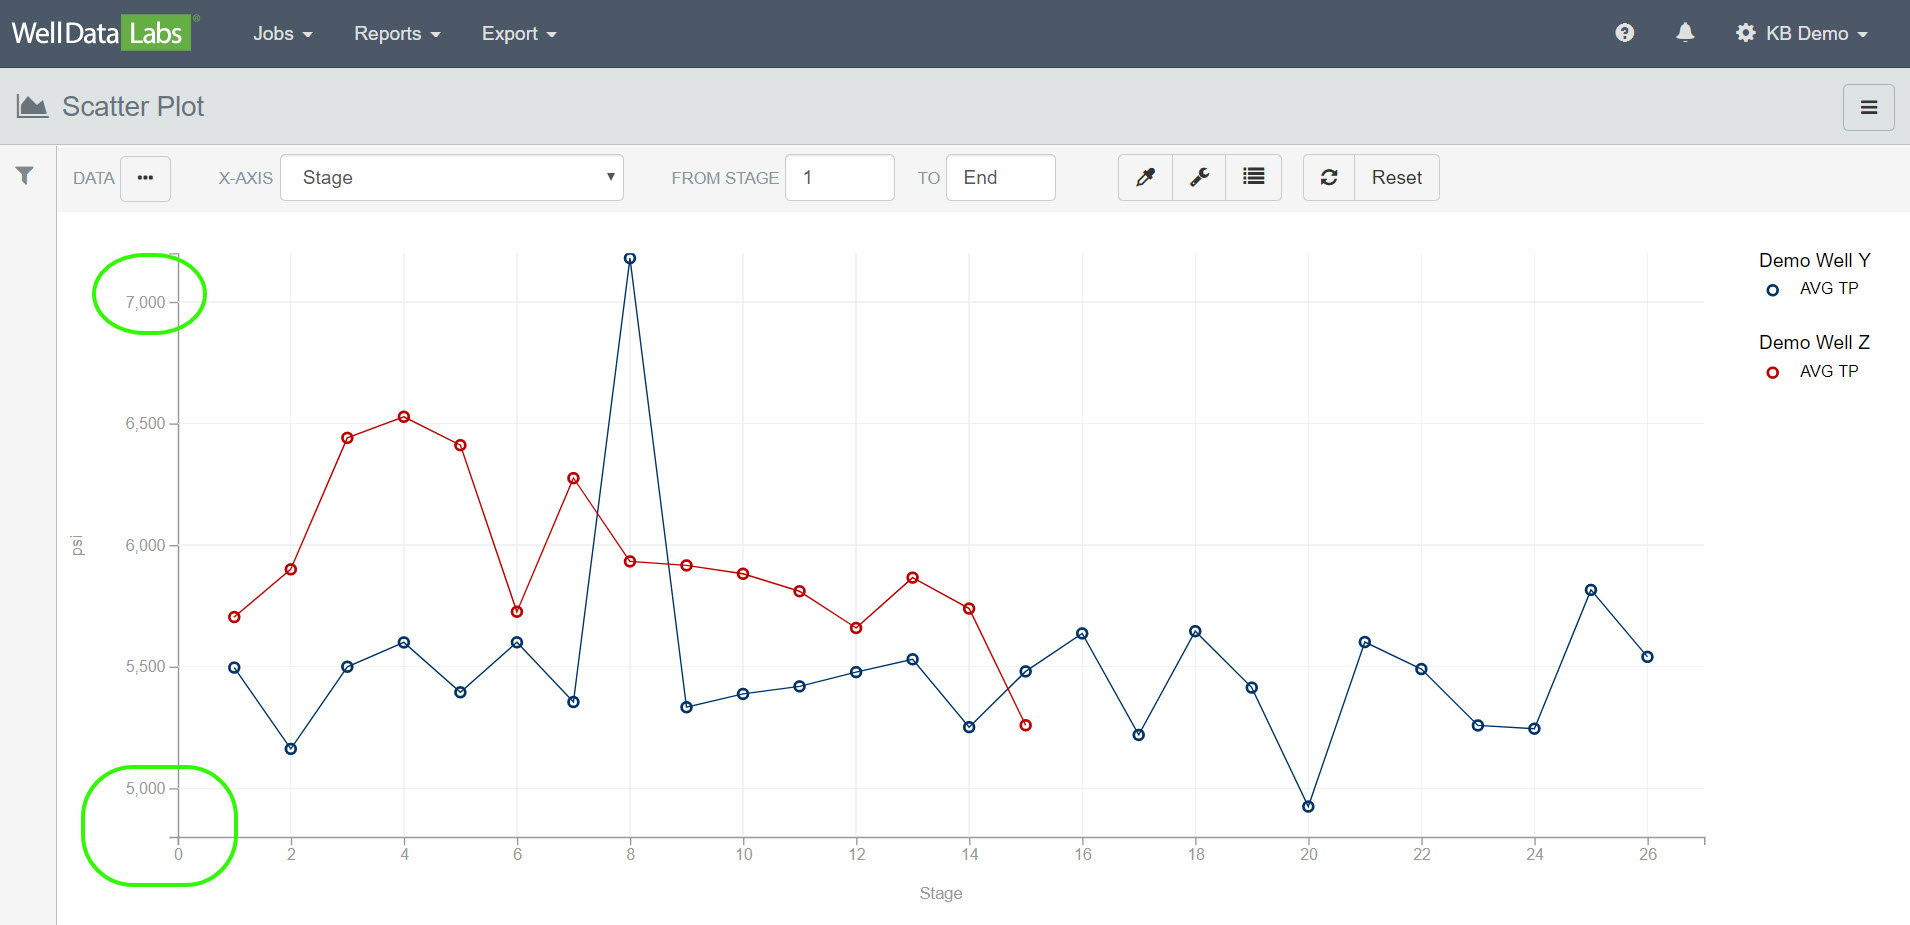
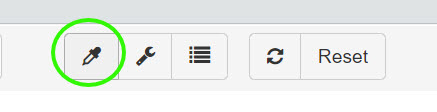
Chart colors can easily be customized by clicking on the "dropper" icon on the toolbar.
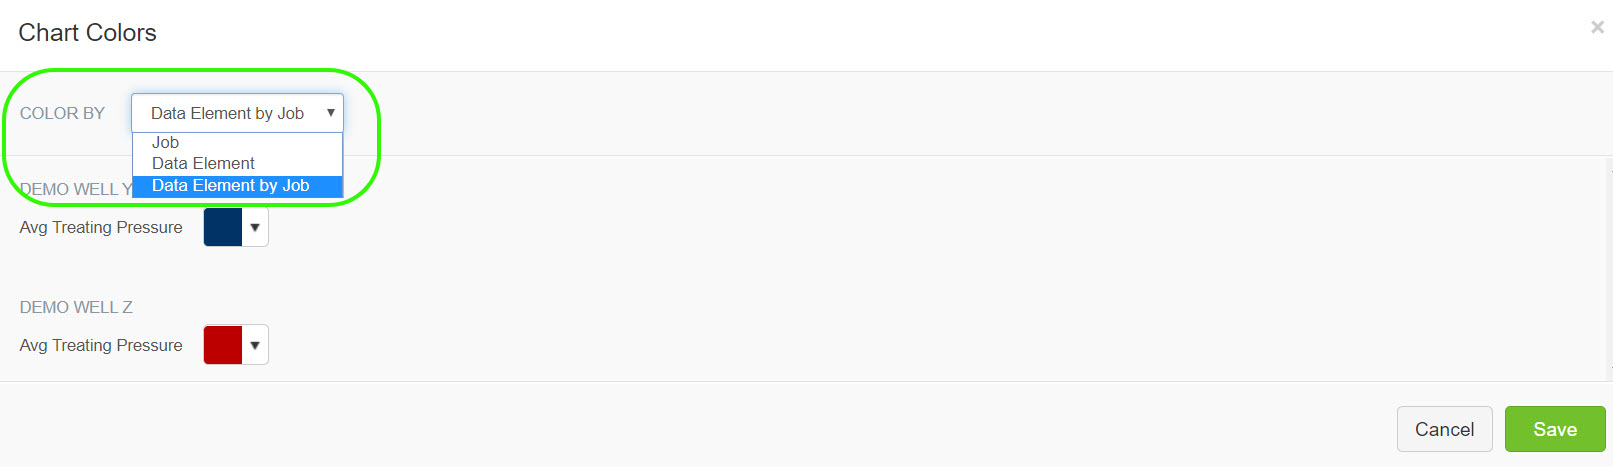
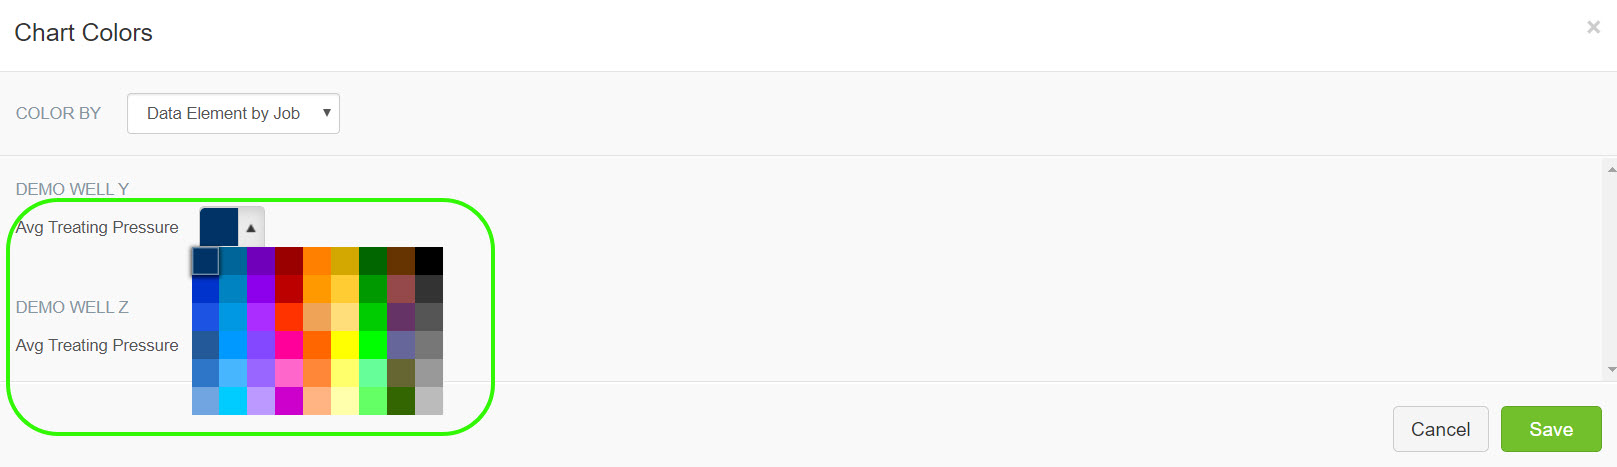
The Color By drop-down lets you choose how you would like to color your chart. Use the drop-down next to each element to make your color selections.
If you were to select multiple data elements to view at the same time, the shape of the marker on the graph for the second and third elements will automatically change. Even so, we've found that more than three elements with more than a couple wells gets to be a hard-to-read graph.
Cross Plotting:
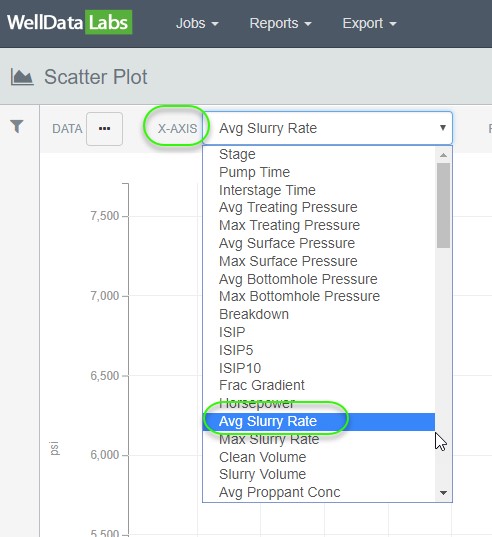
A great feature in the Scatter Plot chart is to cross-plot data types against one another. Click the X-AXIS drop-down and make a selection.
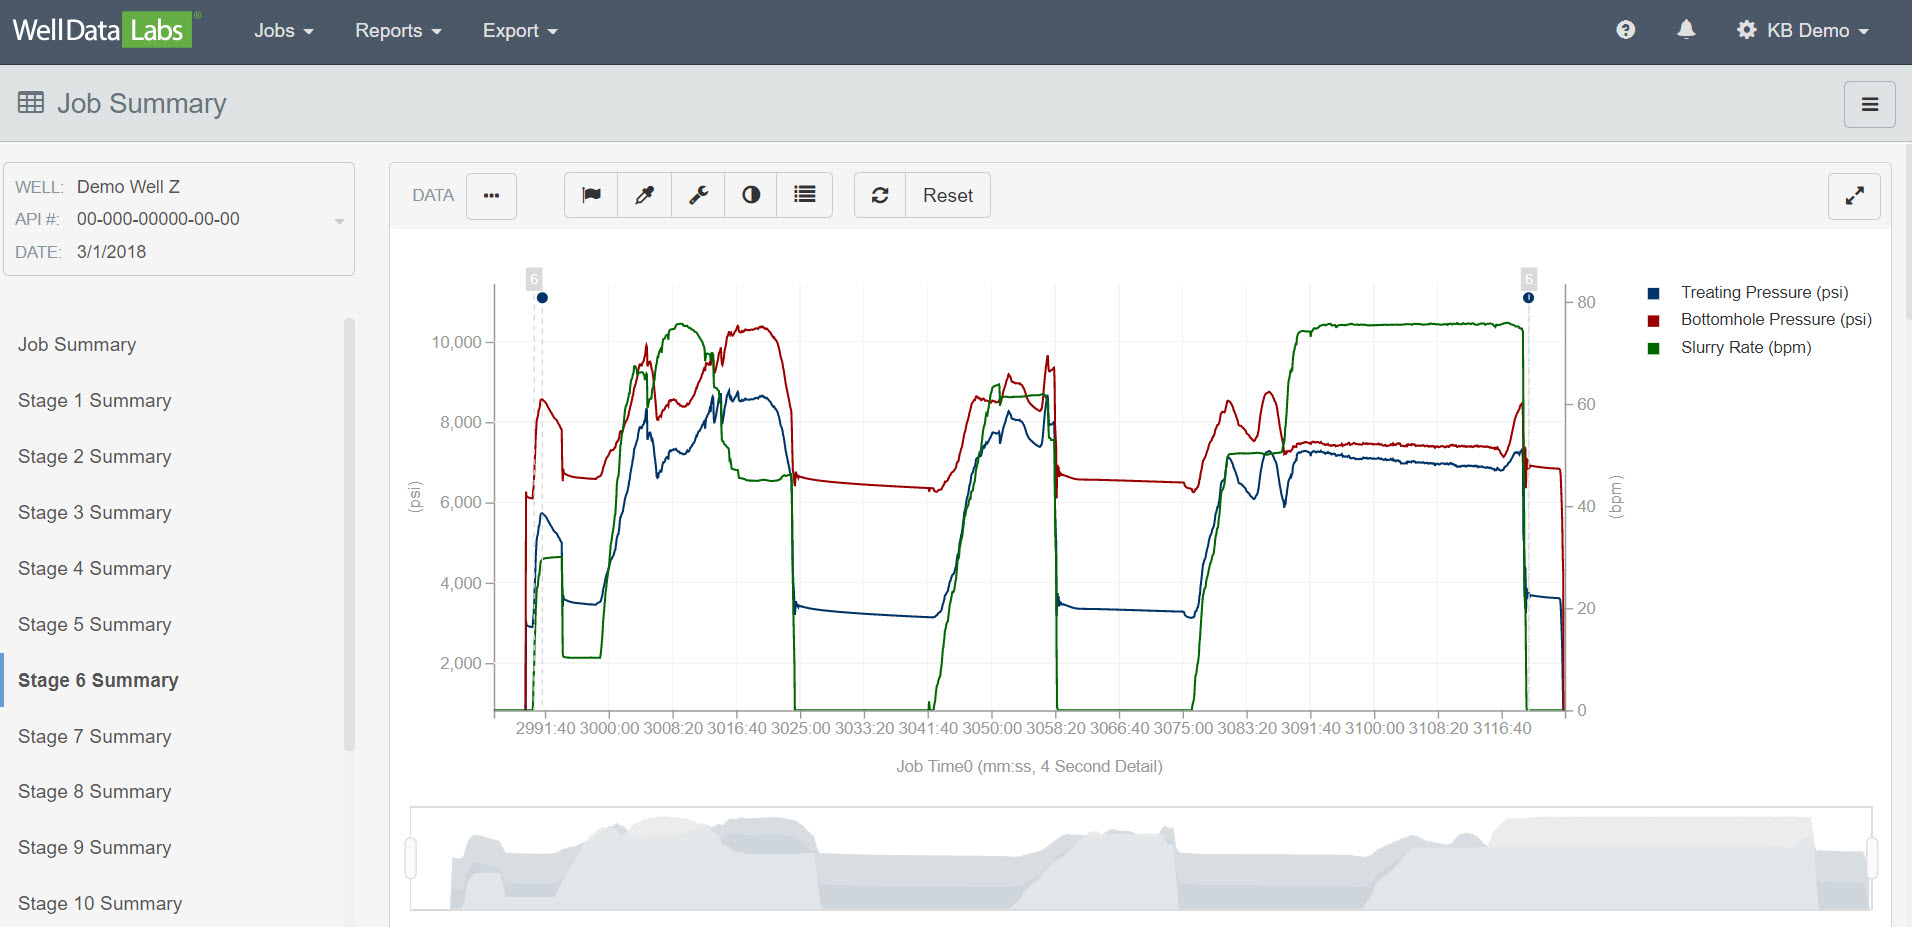
A right click on any data point will navigate you to the Job Summary page for that point, so you can see all the associated high-frequency and summary data.
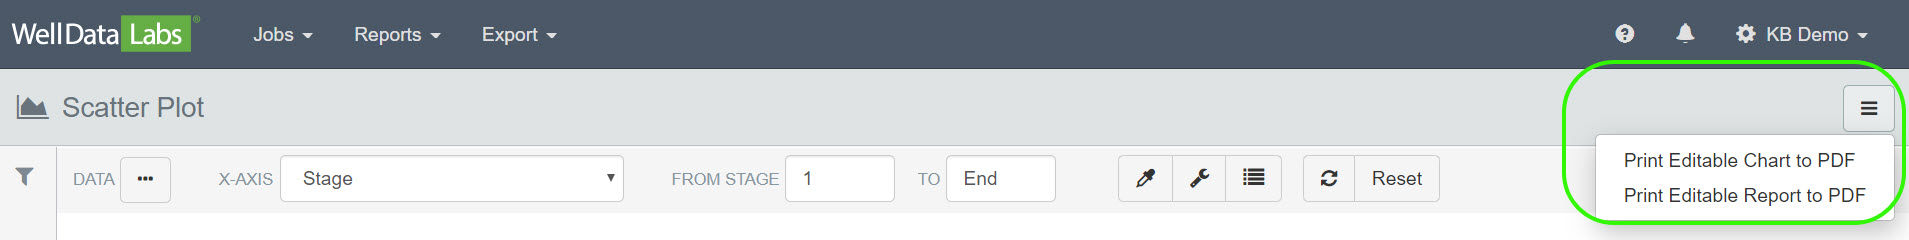
Printing the Scatter Plot:
As with other reports in Well Data Labs, you can easily print an Editable Chart or Editable Report to a PDF file. Just click the 3-bar button in the upper right-hand corner of the Scatter Plot page and make your selection.
.
The Scatter Plot is just one of the tools used for comparison reporting. Be sure to check out our Stage Comparison and Job Totals reports!