You've finished Data Mapping and now you are ready to see how everything looks! Click on over to the Job Summary Report where Well Data Labs gives you an entire job breakdown as well as a stage-by-stage summary with an interactive graph. All of your Data Channels and Data Channel Types are displayed on the report.
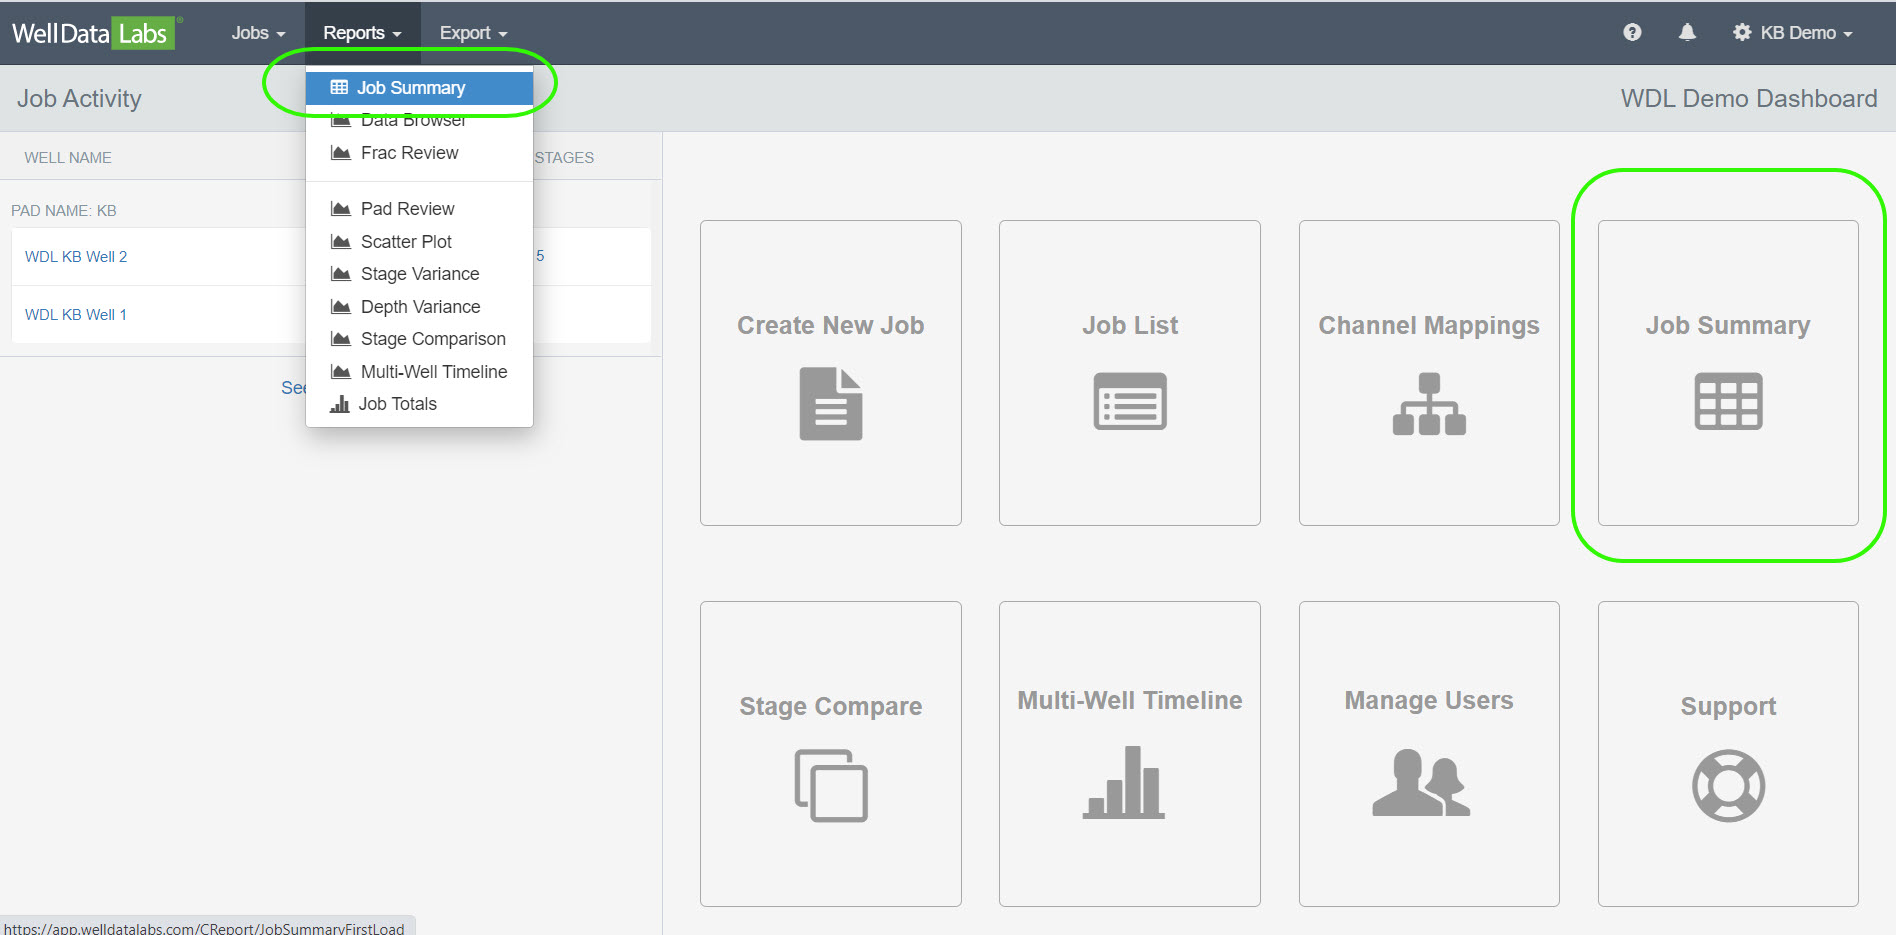
You will find the Job Summary Report in the Reports drop-down on the toolbar or you can access it by clicking on the Job Summary tile on the Dashboard.
Using Job Summary:
Find the well you would like to analyze by clicking on the down arrow next to the API # in the Job Selector found on the upper left-hand side of the screen or by typing the well name in the search box.
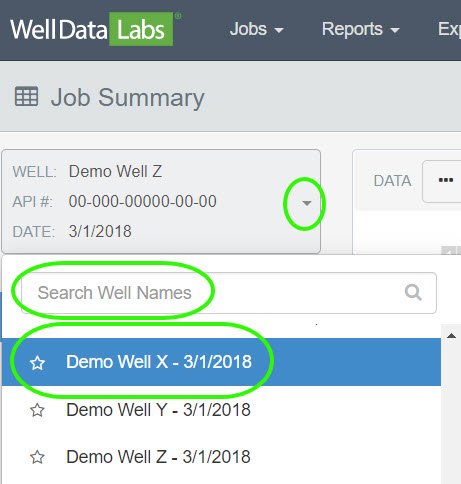
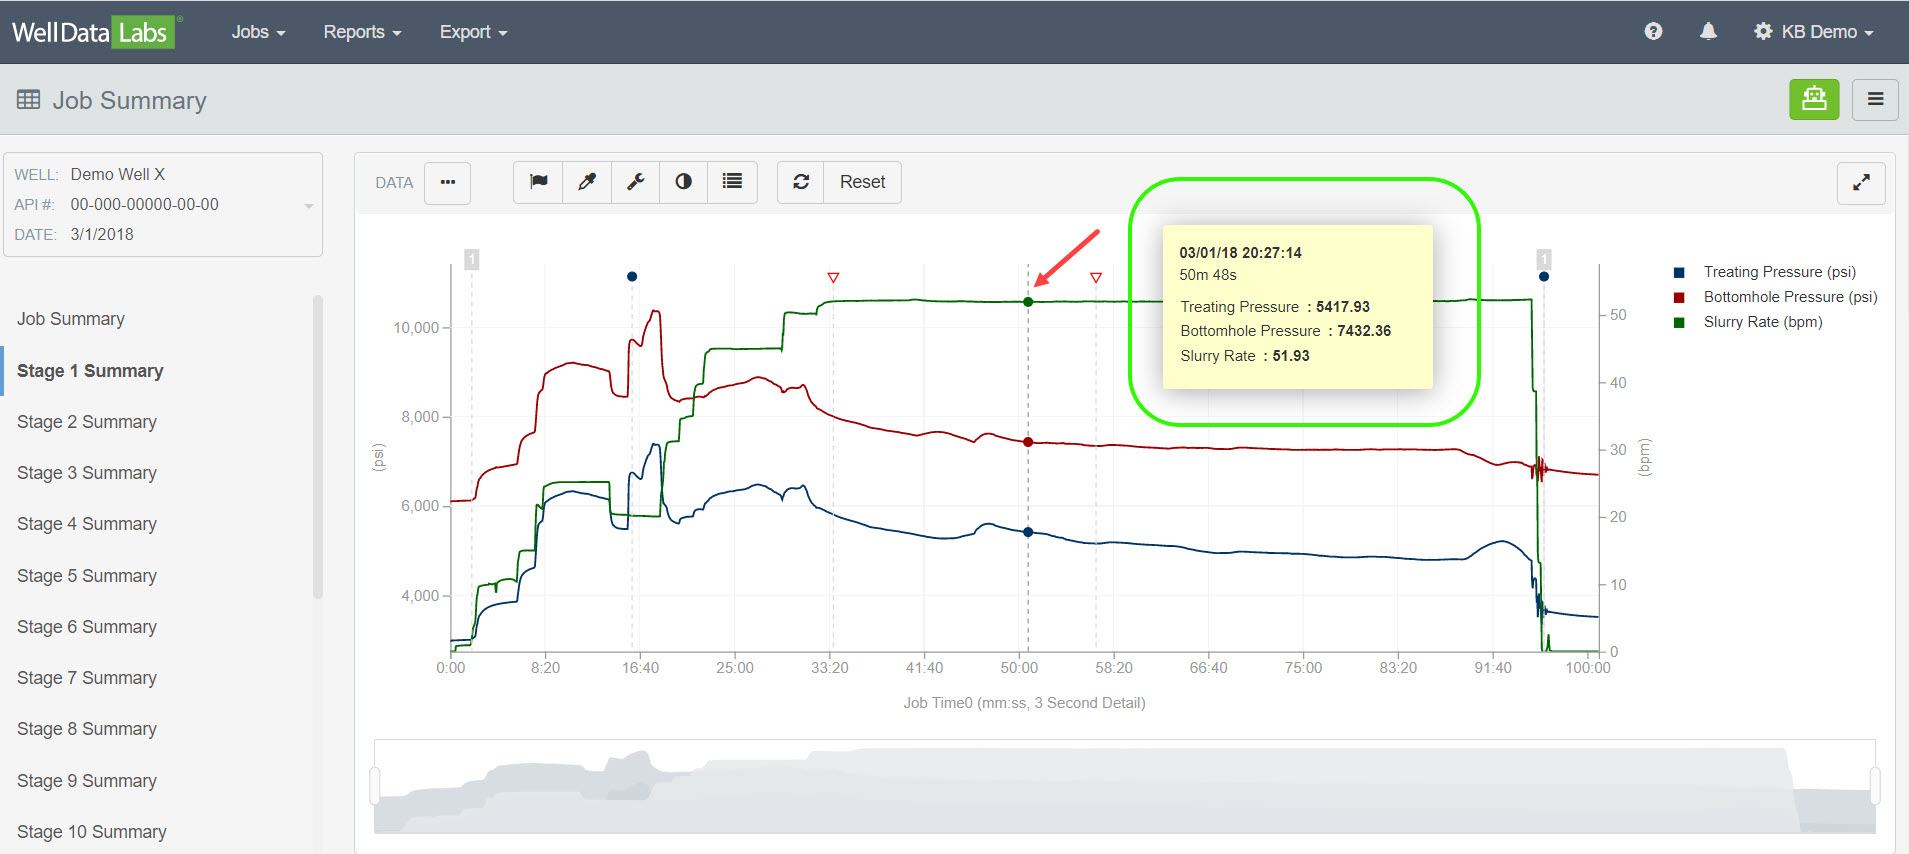
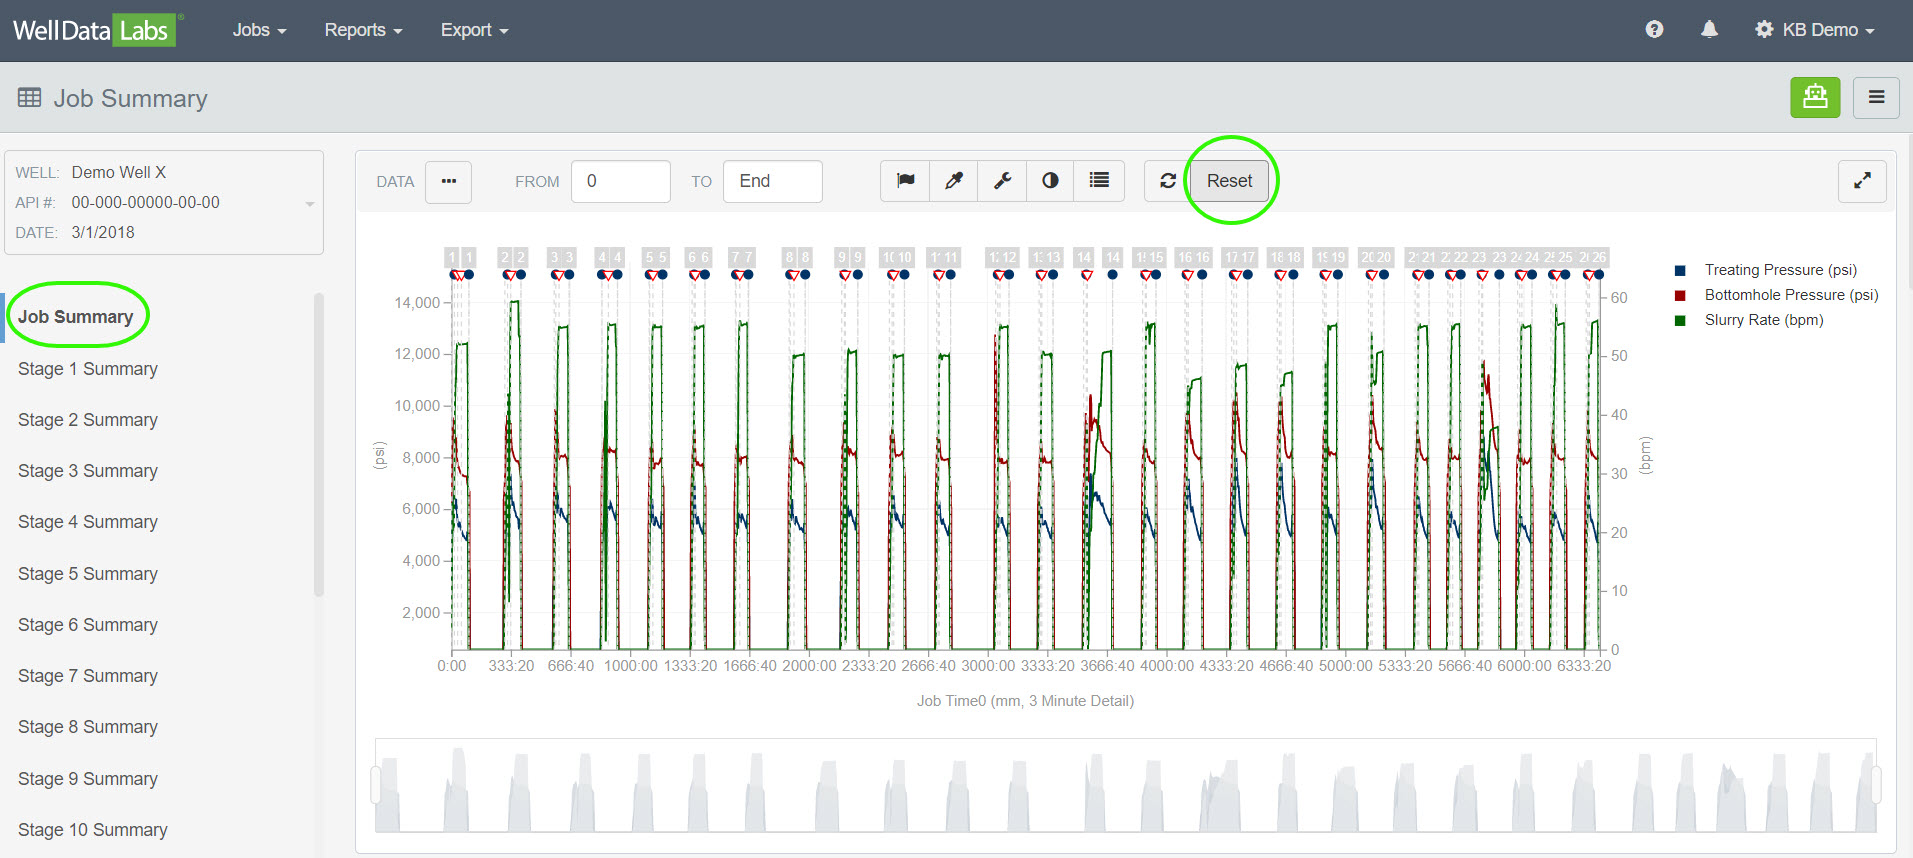
The graph in the middle of the screen will populate with the selected well's job data.
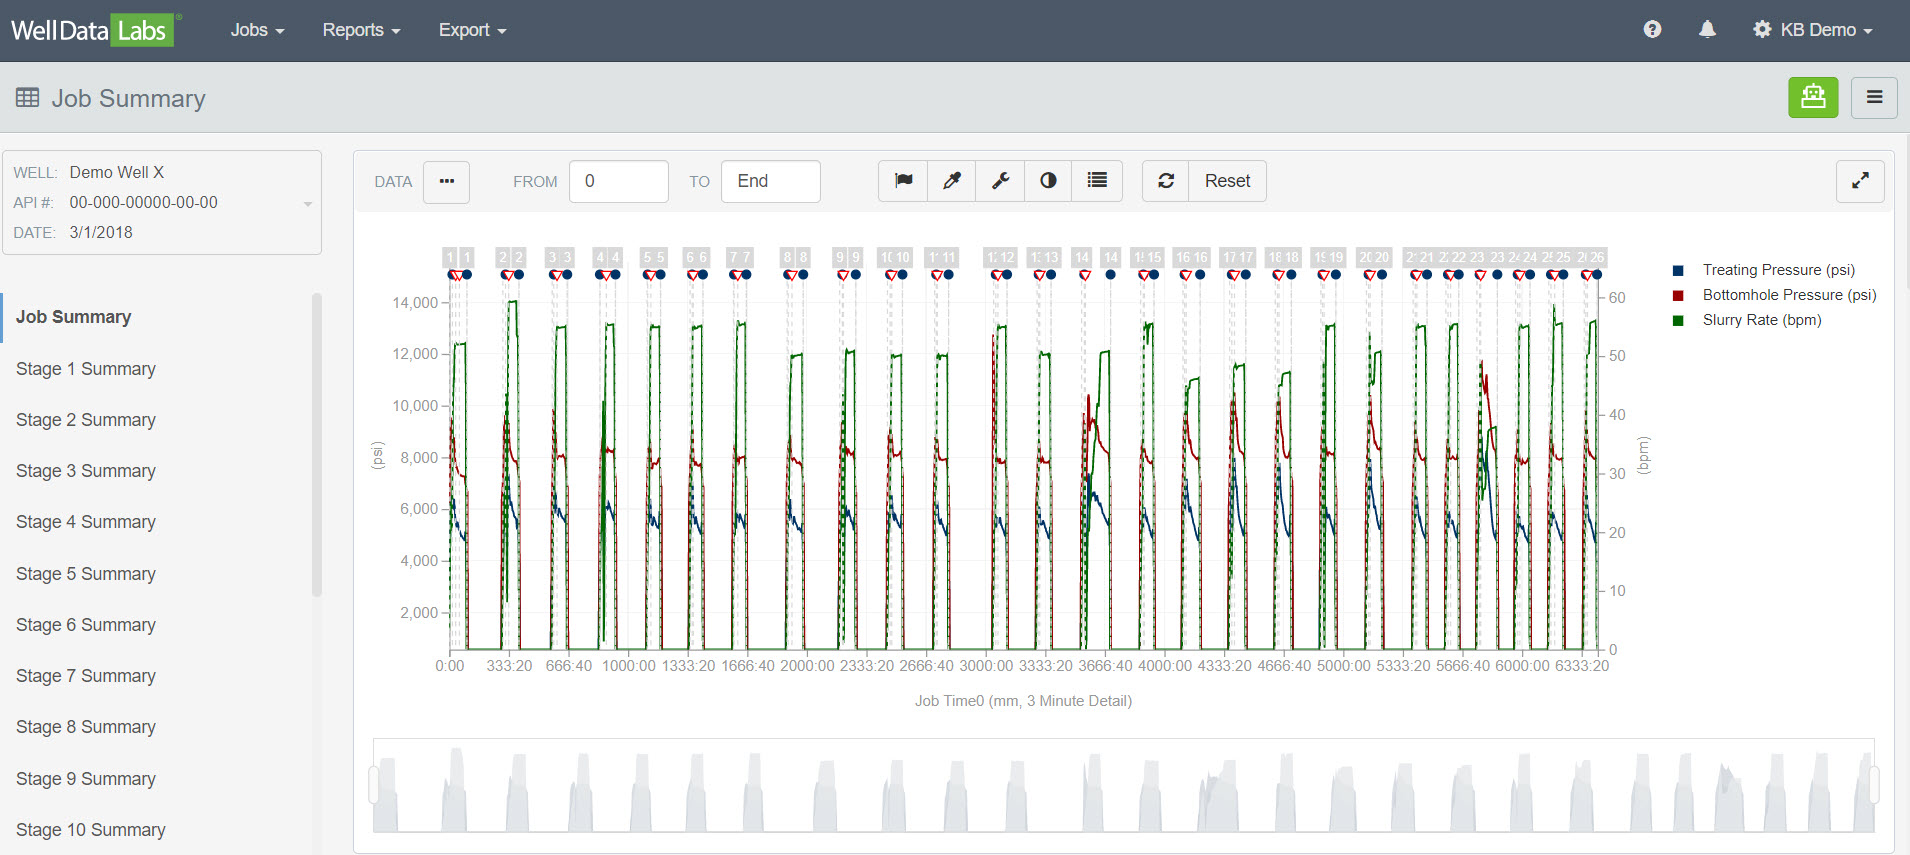
If you have mapped the Stage Start/End Times in Stage Mappings, you will have the option of viewing the summary for the entire job by selecting Job Summary or select an individual stage using the selection on the left-hand side of the screen.
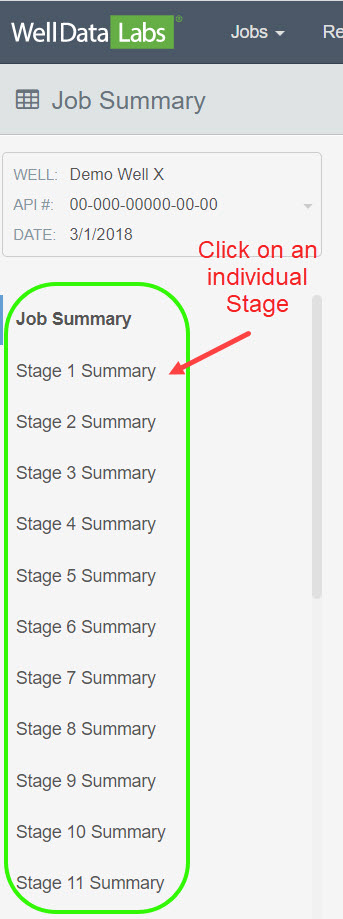
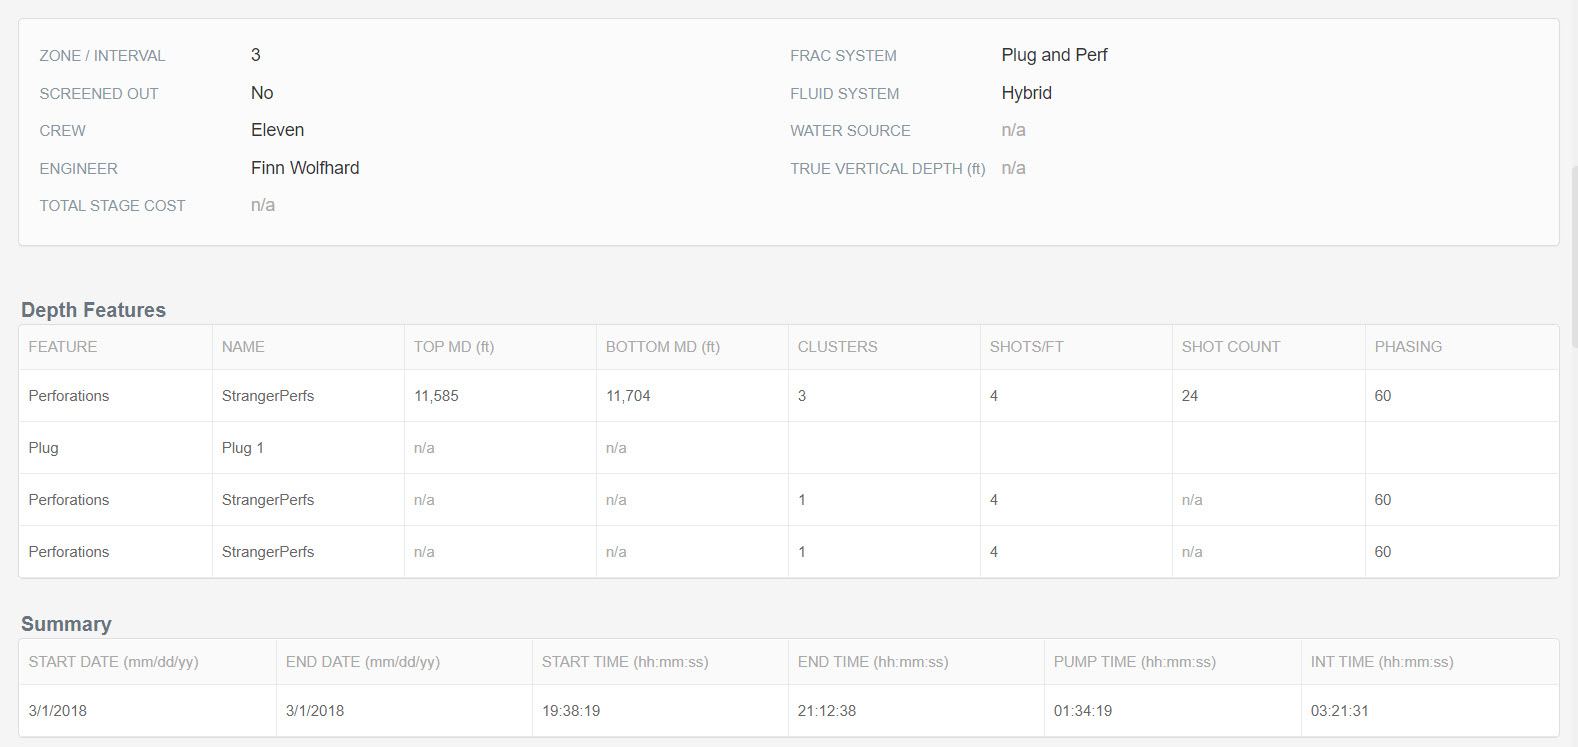
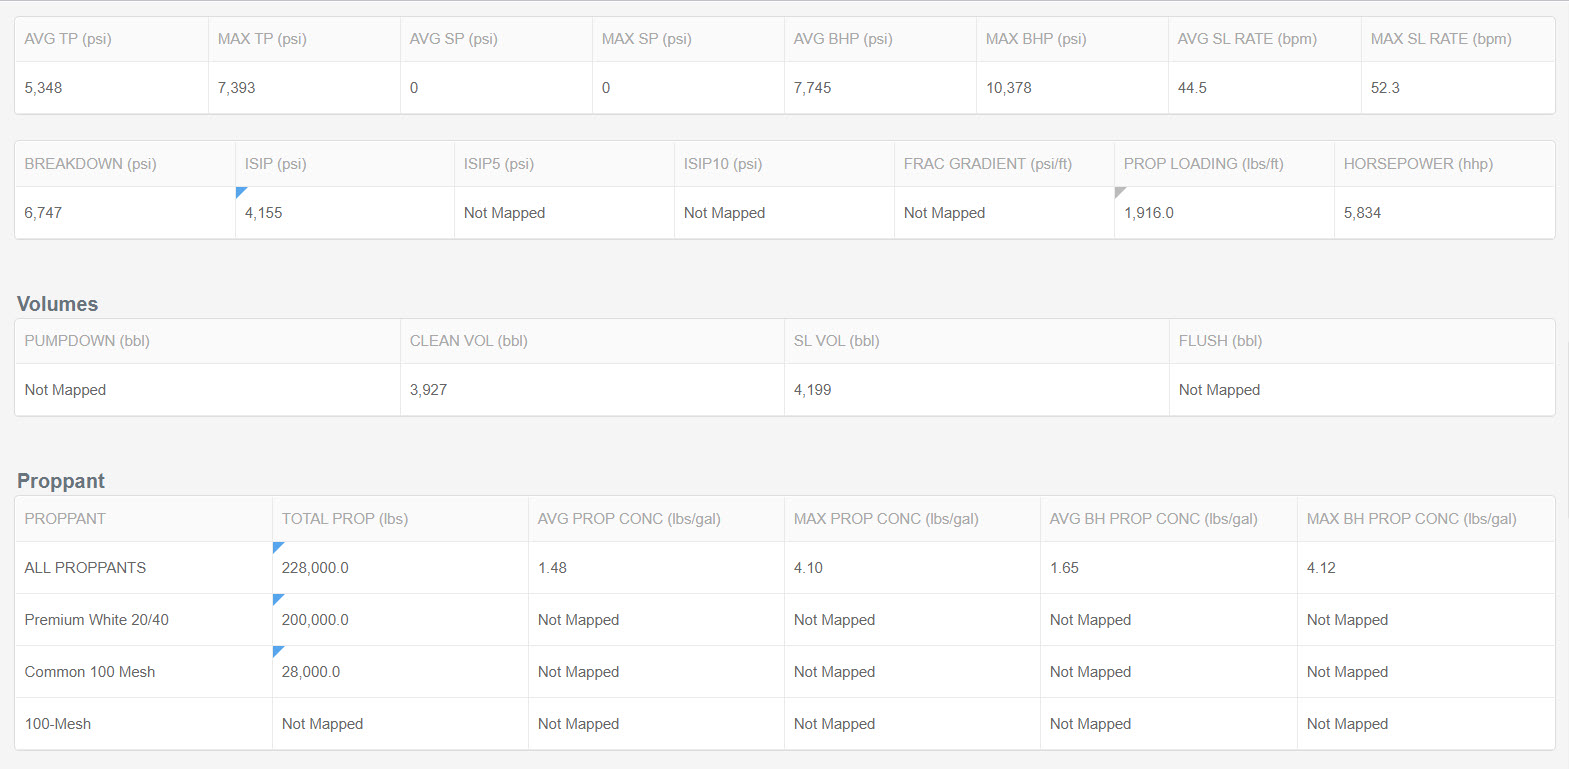
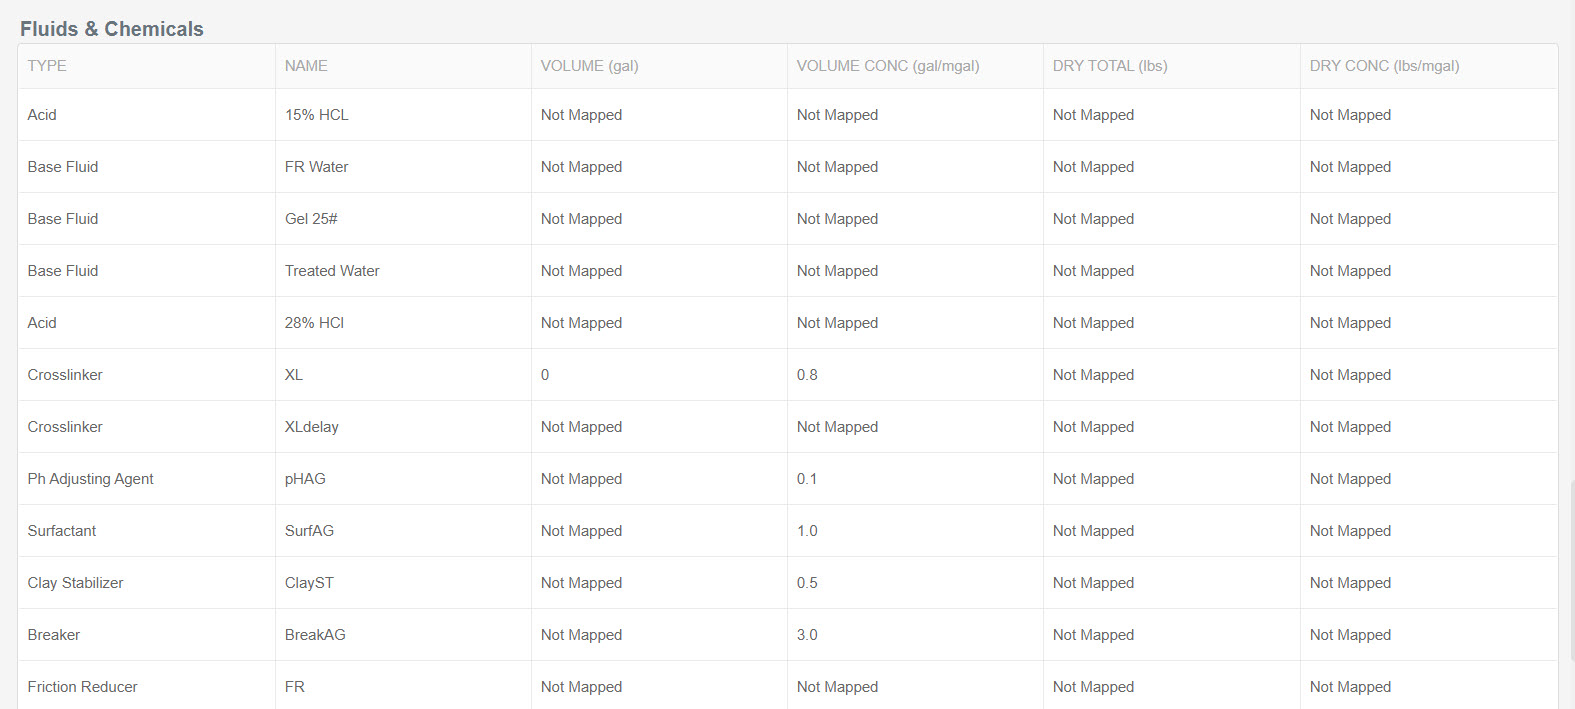
In this example, we are looking at the Stage 1 Summary. Hovering your mouse over the graph will cause a "dotted tracking line" and "popup tooltip" to detail the data points one by one. Just below the graph, the tables display Depth Features, Summary, Volumes, Proppant, Fluids & Chemicals, and Tracers for the selected stage.
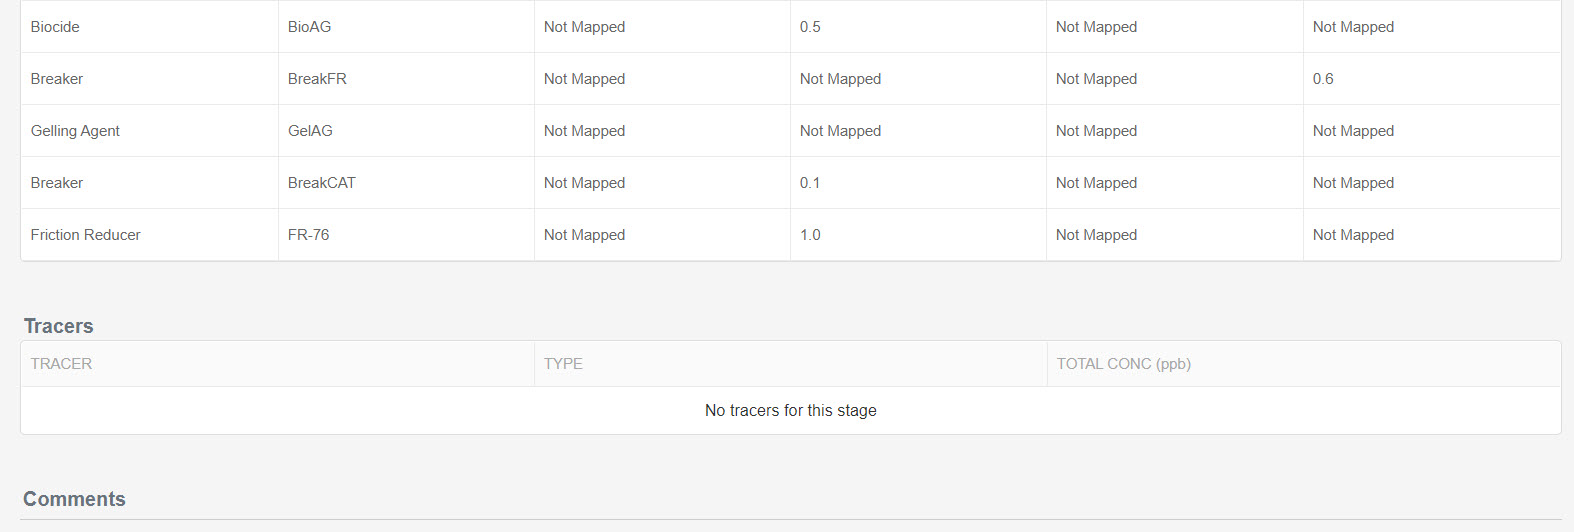
Selecting Job Summary will display tables below the graphs that provide quick and accurate summary data from your jobs.
** Please Note: If you switch from Stage Summary to Job Summary, click on the Reset button on the toolbar to see all of the stages display on the graph.
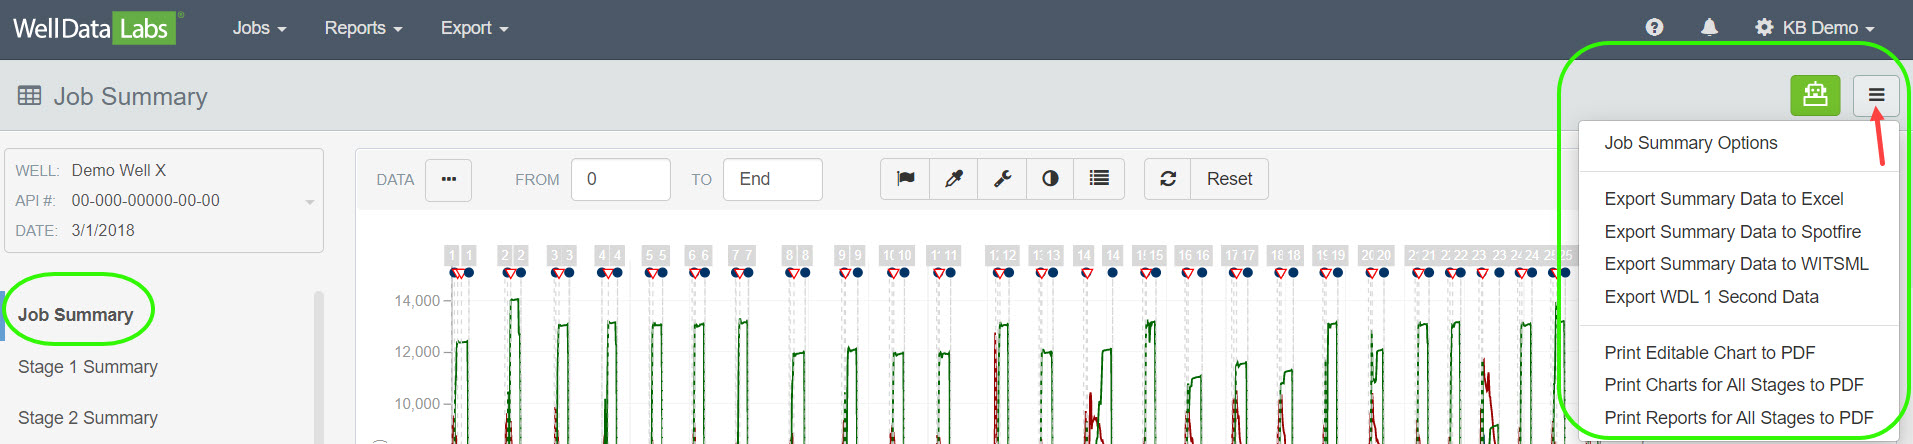
The 3-bar button in upper right-hand corner of the screen will allow different options when you are on the Job Summary view vs. the Stage Summary view.
Clicking the 3-bar button while on the Job Summary will give you several options.
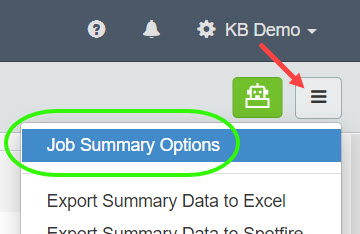
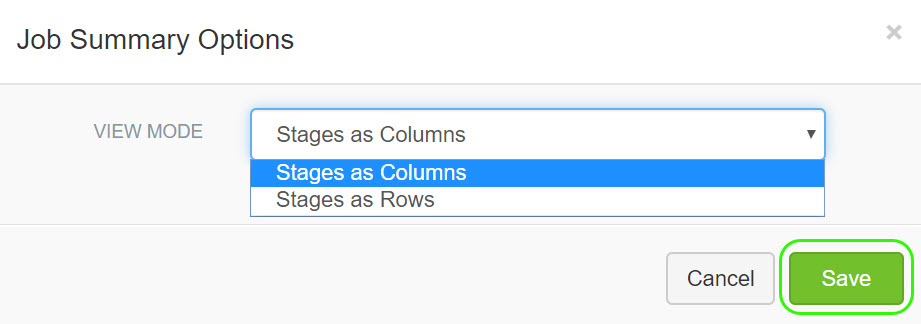
Job Summary Options:
Selecting this option allows you to transpose the heading format of the tables that display under the chart.
Click Save after you have made your selection.
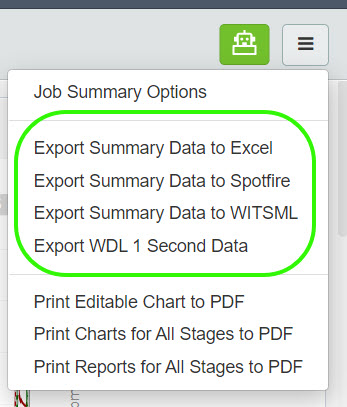
The next set of options are export features including:
Exporting the current table, displayed under the graph, into Excel
Exporting the displayed data into Excel in a Spotfire compatible table
Exporting the summary data to WITSML
Exporting WDL 1 Second Data into a .csv file
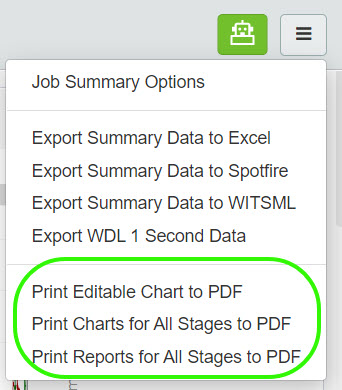
Printing an Editable Chart to PDF:
Select one of the Print options and a PDF file will download to your machine.
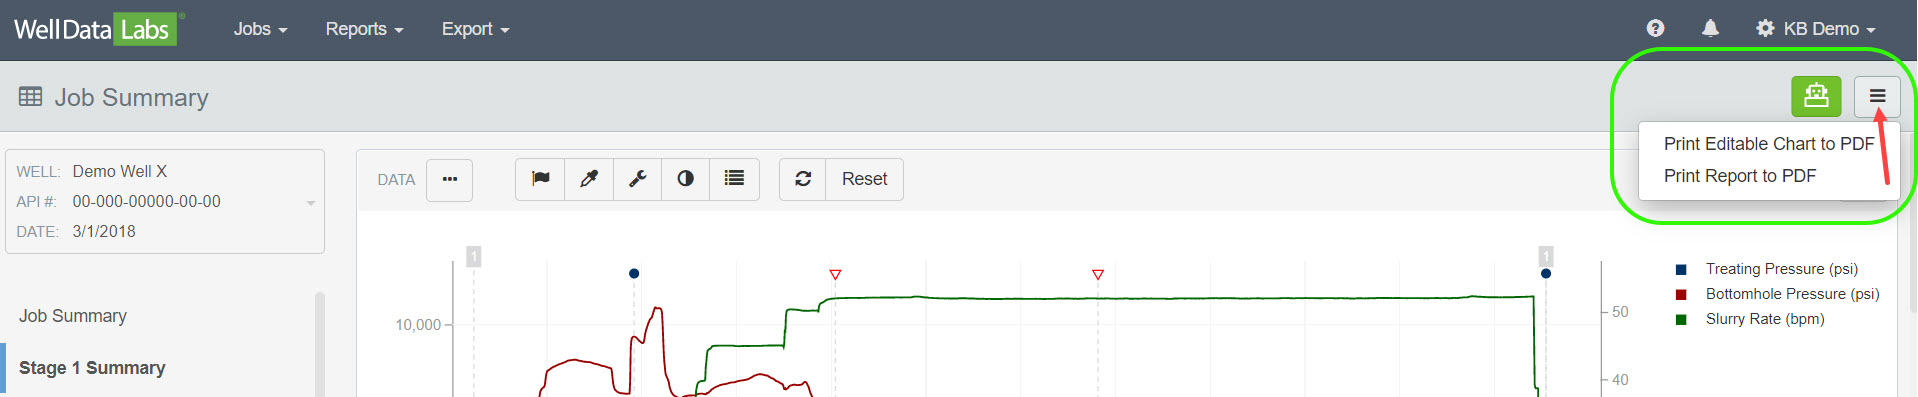
Stage Options:
Clicking the 3-bar button while on a Stage Summary will give you the options to print an Editable Chart or Report to a PDF.
There are lots of graph features and customization options available in Well Data Labs; learn more about them on the Graph Features article.
Also, take a closer look at the Job Summary Tables and different options to Export your Data.