Reports/Data Analytical Tools
Scatter Plot: Plotting Times Between Custom Flags
Last updated on 23 Oct, 2025
Have you ever wondered how long it takes to hit a specific milestone in a stage? For example Time-To-Rate? This month we released a new feature designed to make your analysis even more efficient!
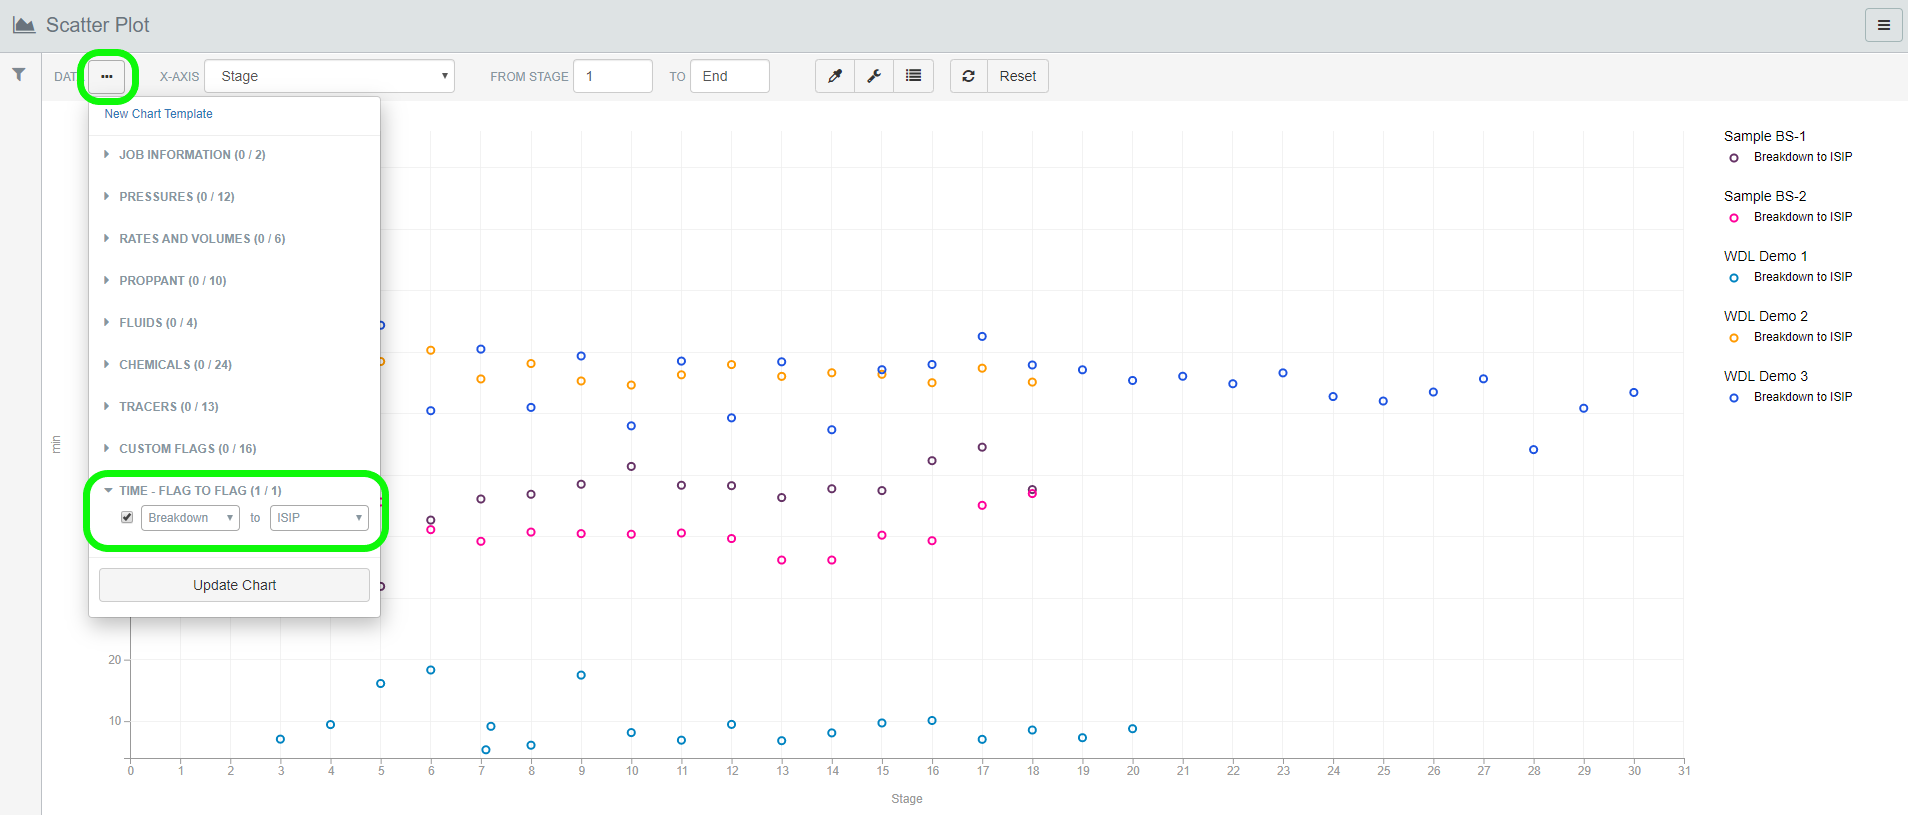
Custom Flags have always been a powerful way to identify any particular section of the treatment, such as an acid slug, a diverter drop or a change in proppant type among others. Now, these flags can be also used to plot the times between any two same-stage flags on the Scatter Plot report!

From the 'DATA' drop-down menu, scroll to the bottom and you will see the option 'TIME - FLAG TO FLAG.' In both of those drop-down menus you will see all available flag options that exist in the wells that have been selected, however, please note that this does not mean every stage and every well has all flags plotted.
Please Note: Both flags must exist for the stage in a particular well to calculate the time between them and to include on the Scatter Plot.
Have more questions? Have no fear! Click here to schedule a free remote training session or to simply contact our awesome Support Team!

