Question: I want to set Breakdown and ISIP for each Stage. Sometimes I only have one stage I want to set, and other times I have multiple stages to set. What are the different options and is one faster for setting multiple stages?
Answer: Well Data Labs has two options for setting Breakdown and ISIP pressures. The first option is for selecting Breakdown and ISIP pressures on the Stage Mappings page. Here, you'll visually flag the pressures for each stage on the Stage Mappings Chart instead of typing in the values. The second option allows you to manually enter/override the pressures on the Treatment Data page. In this article, we will go over both options.
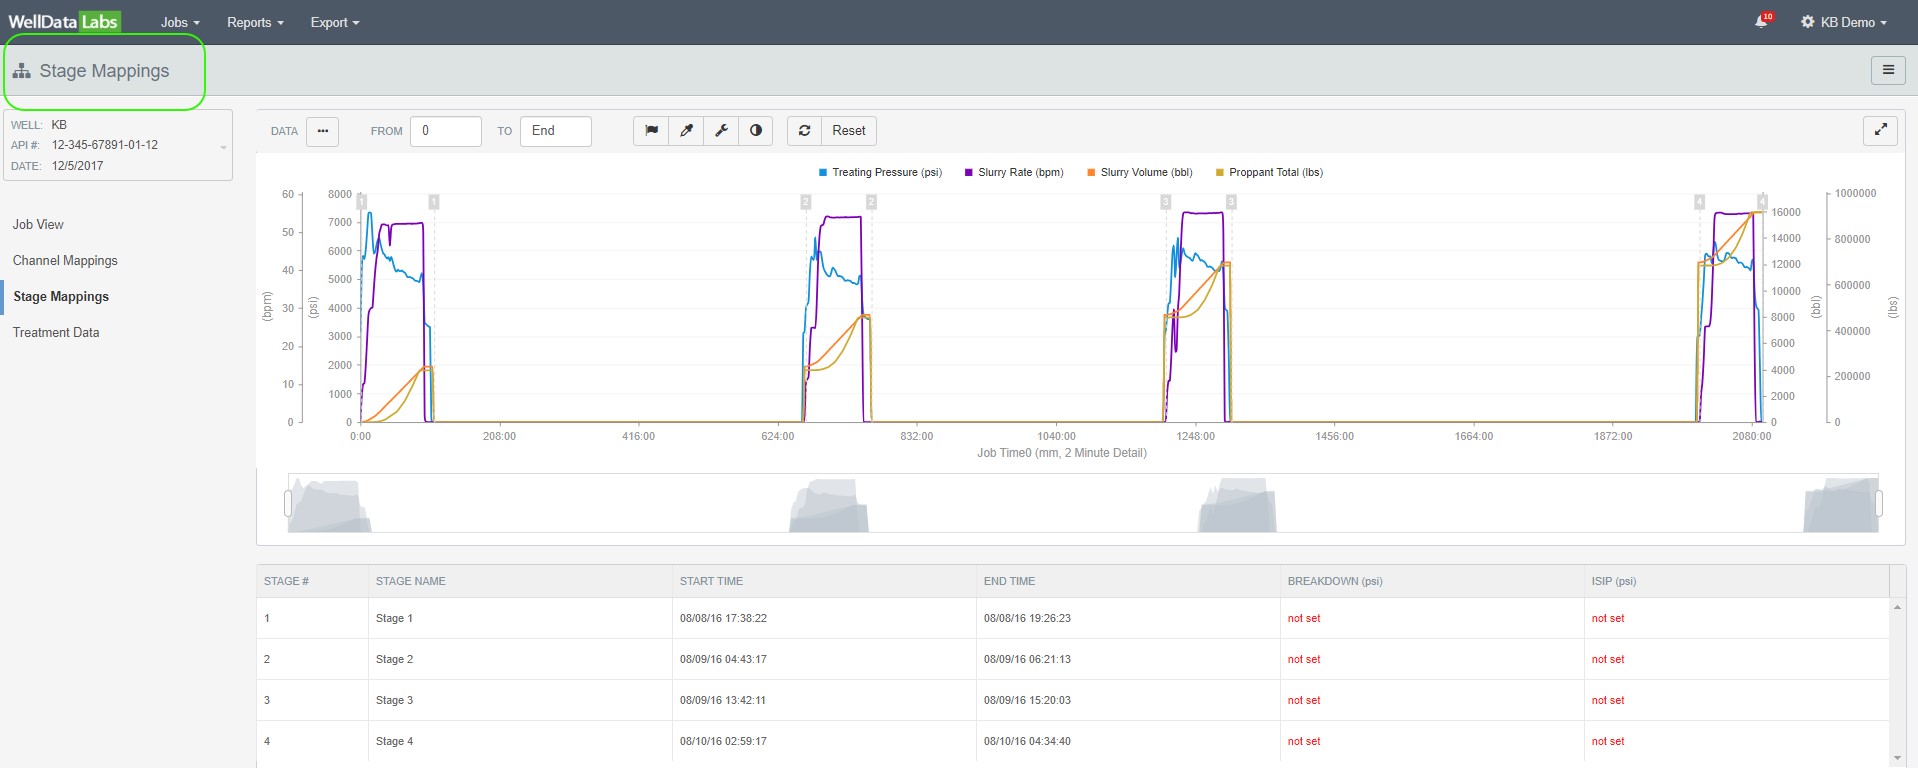
Option 1 - Visually flag the pressures for each stage on the Stage Mappings chart. In the following example, we will set the Breakdown pressure for Stage 2 for a selected Well.
Begin by navigating to the Stage Mappings page for the Well you would like map.
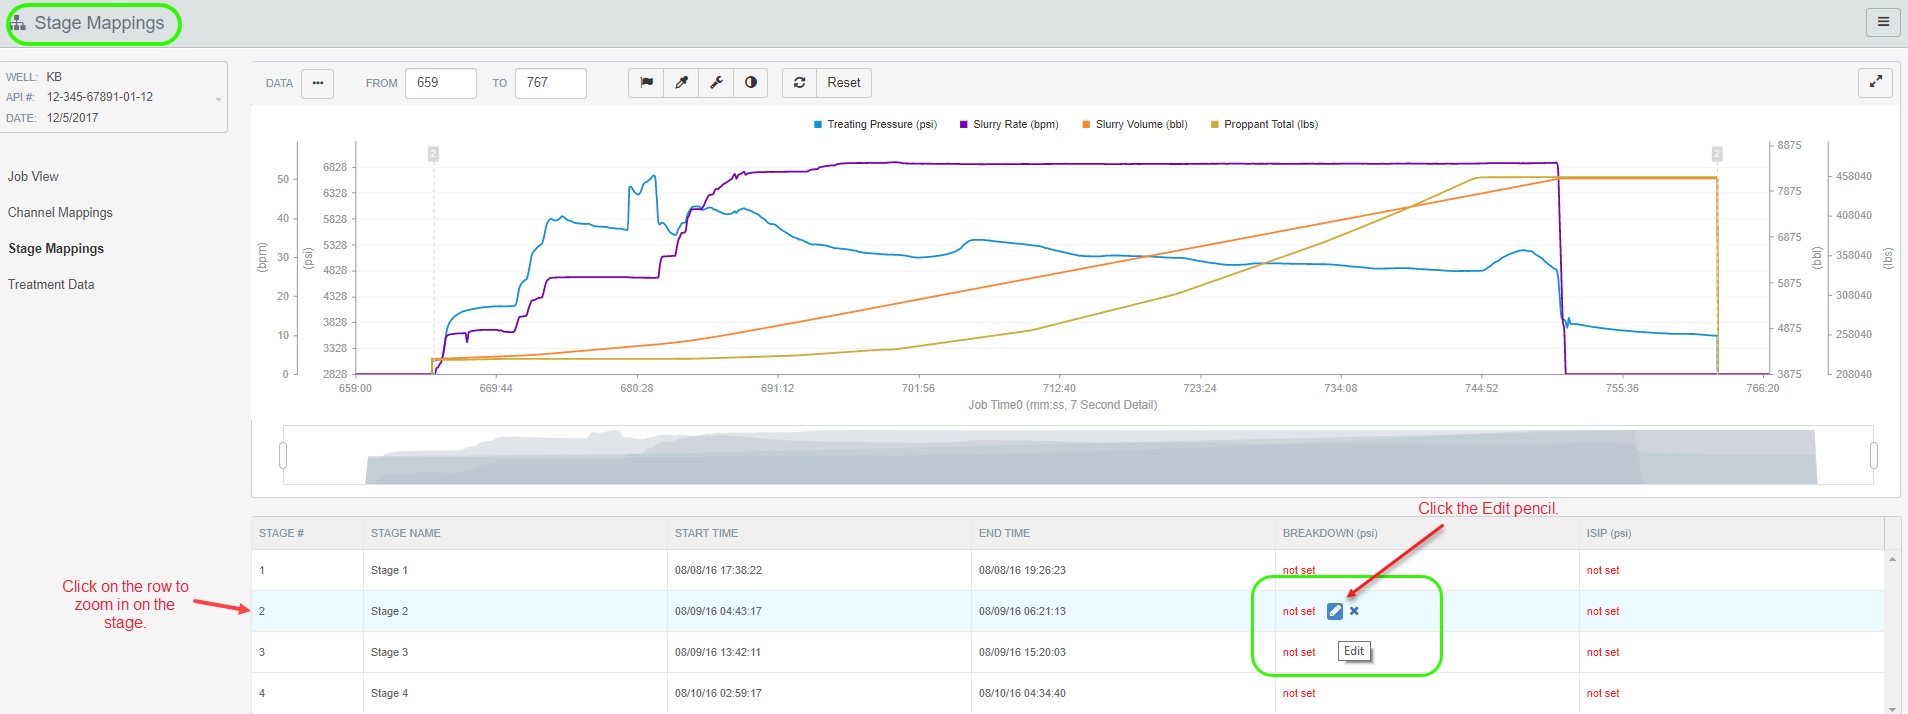
Zoom in on the stage you would like to map by clicking on the stage row in the grid just below the chart. Hover over “not set” next to the Breakdown pressure for the Stage you would like to set. Click the Edit pencil.
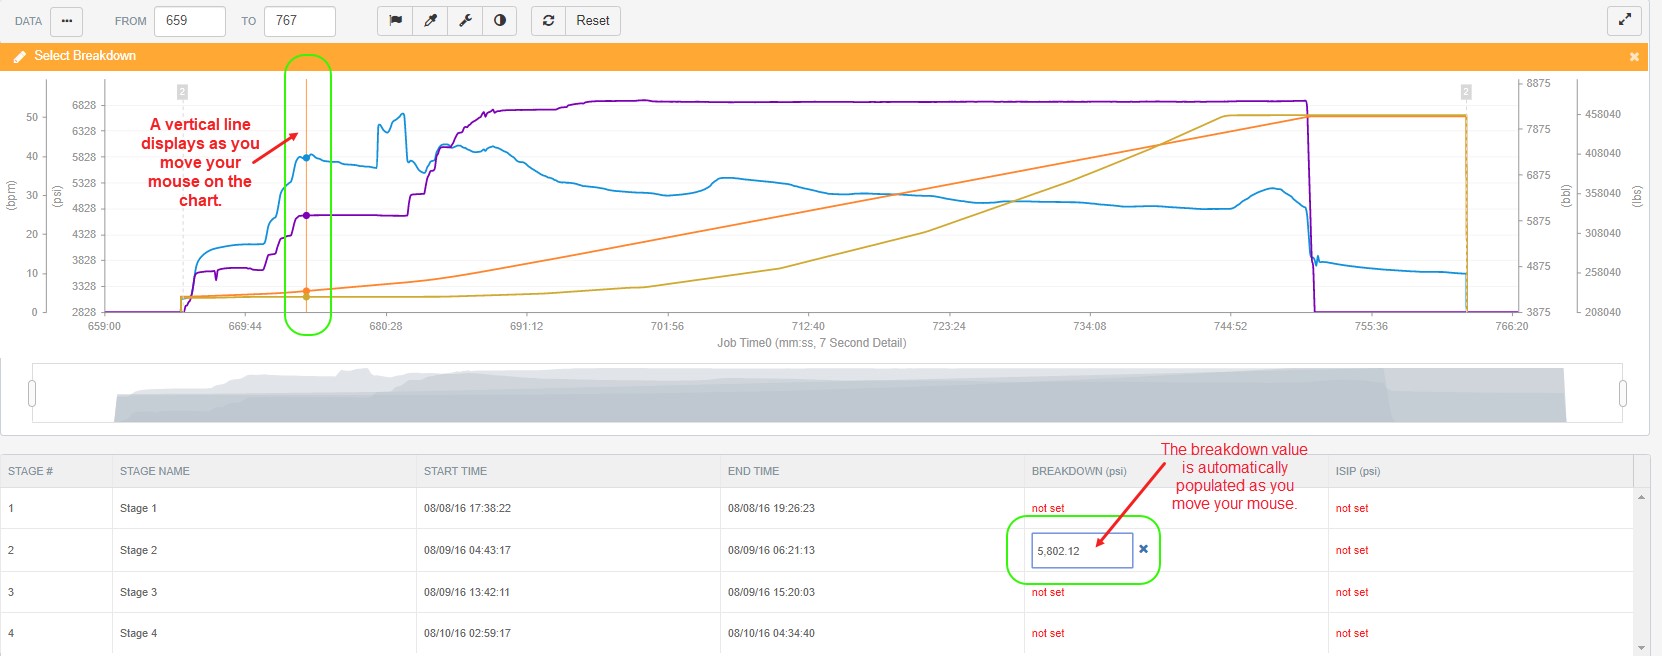
Once you click the Edit pencil, an orange bar will display on the top of the chart with a message prompting you to make a selection.
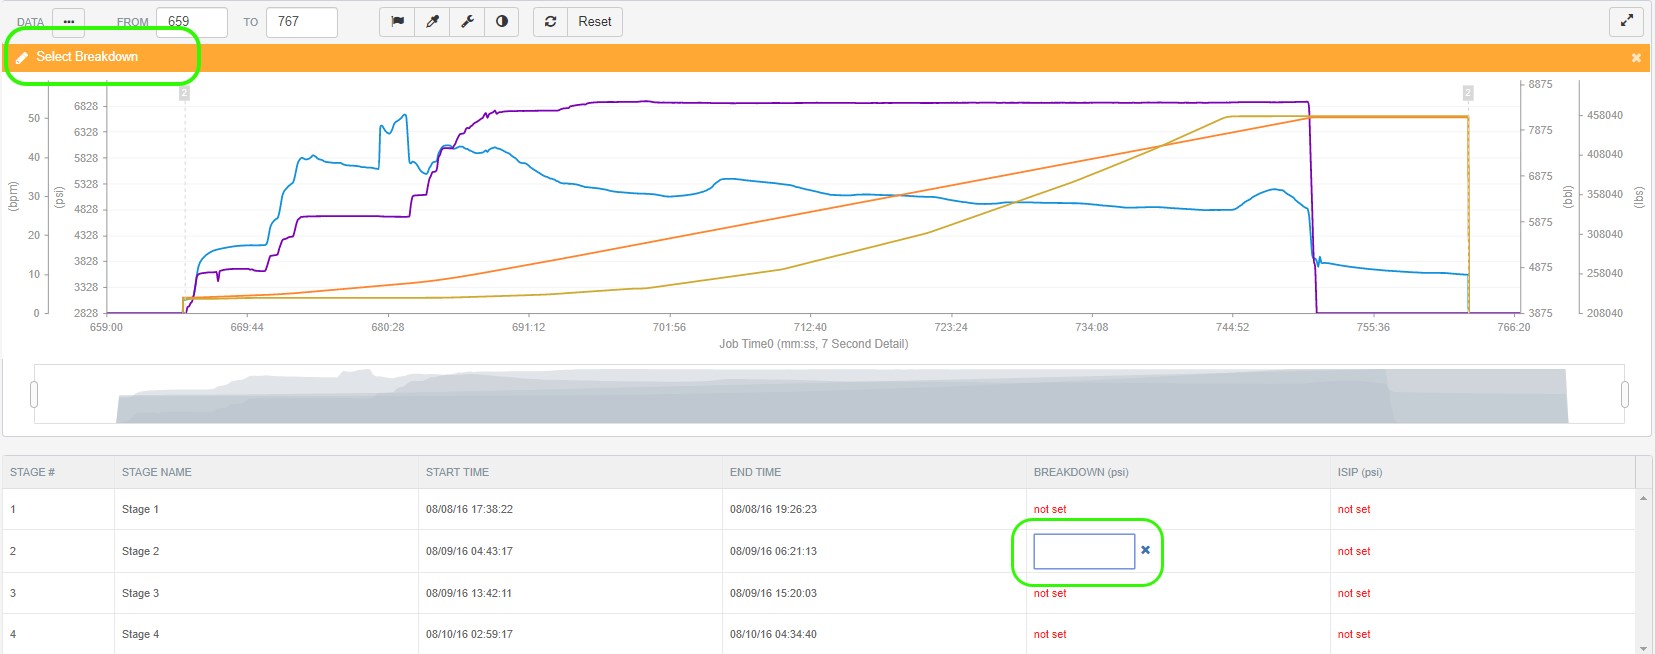
Move your mouse to the point on the chart where you would like the Breakdown to be set and left-click. You will see a vertical line move across the chart as you move your mouse. The Breakdown field in the grid will populate as you move your mouse around on the chart.
** Please Note: The pressures can only be set by clicking on the point on the chart where you want them. They cannot be “typed” into the corresponding fields on the grid below the chart.
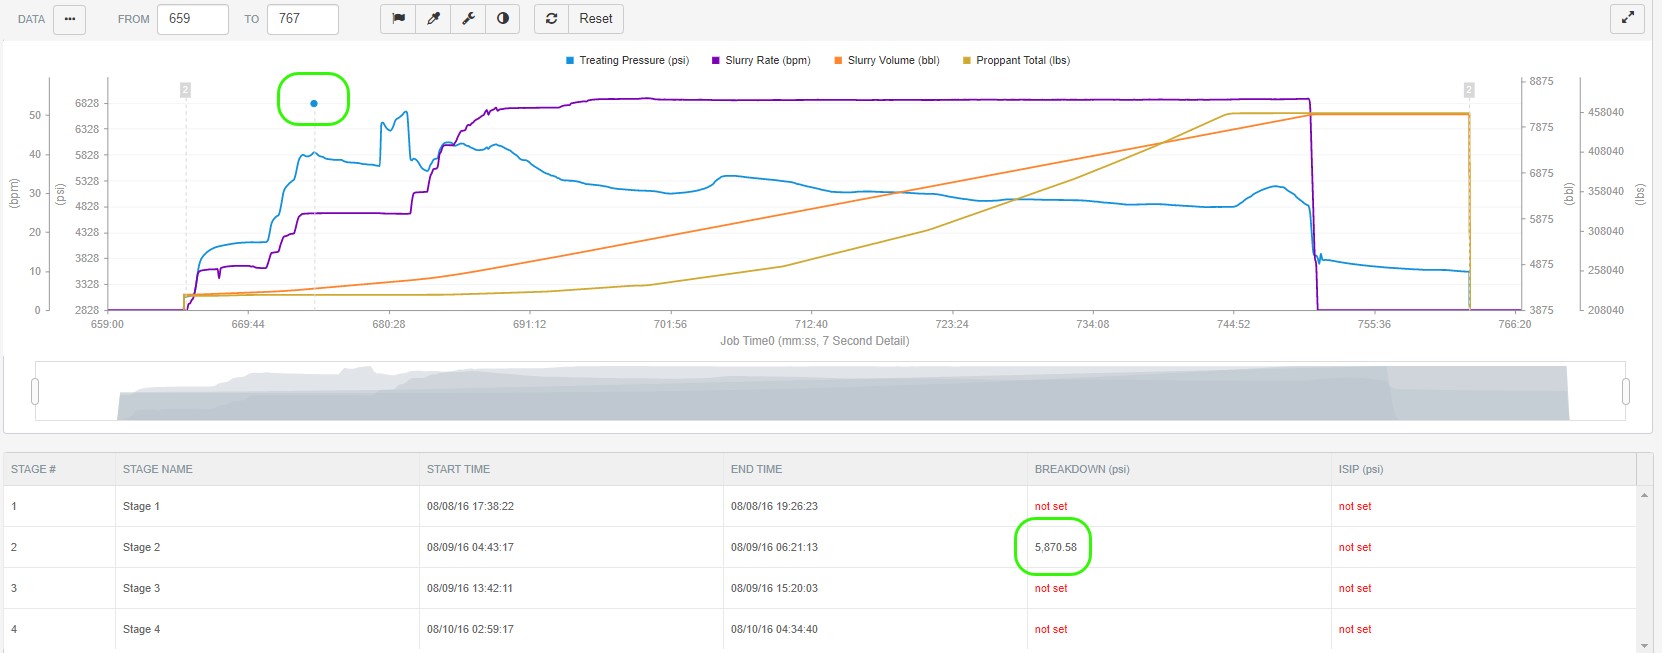
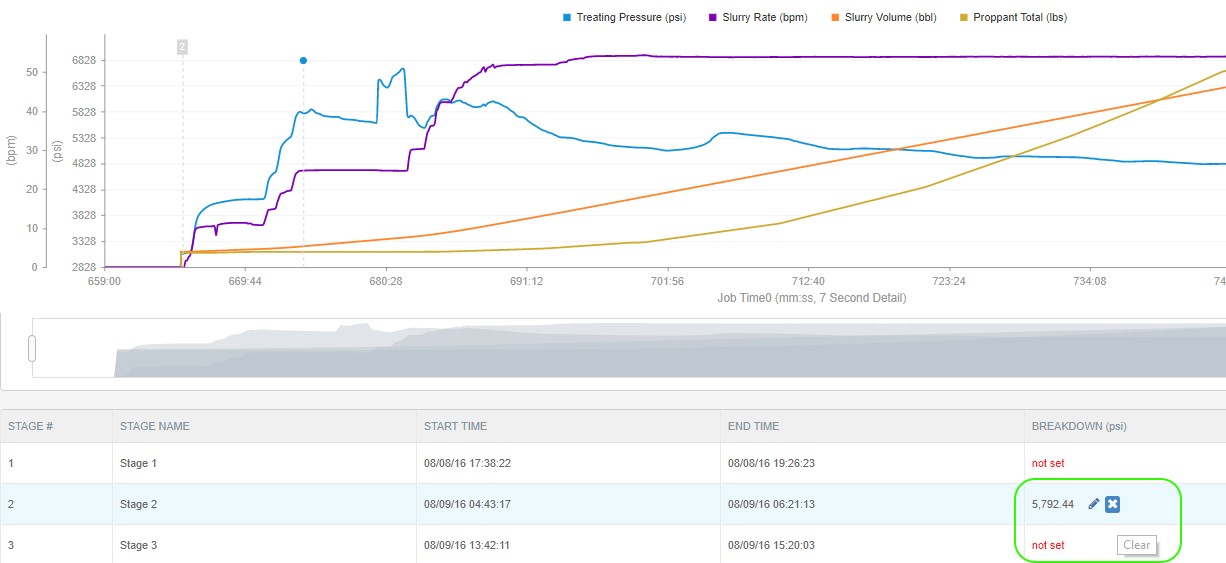
The Breakdown pressure is now indicated by the “blue” dot on the chart. And the value is displayed in the grid below the chart.
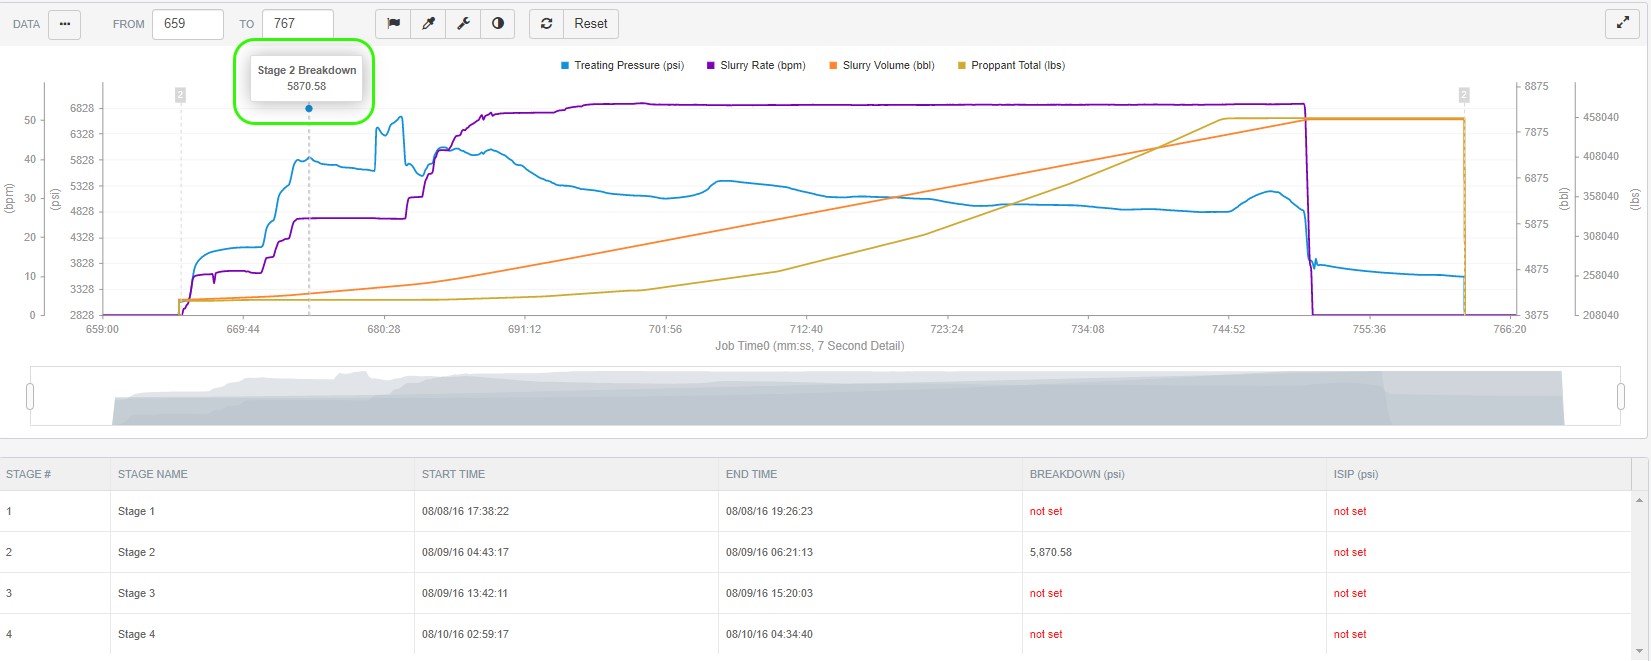
Hovering over the blue dot will display the value.
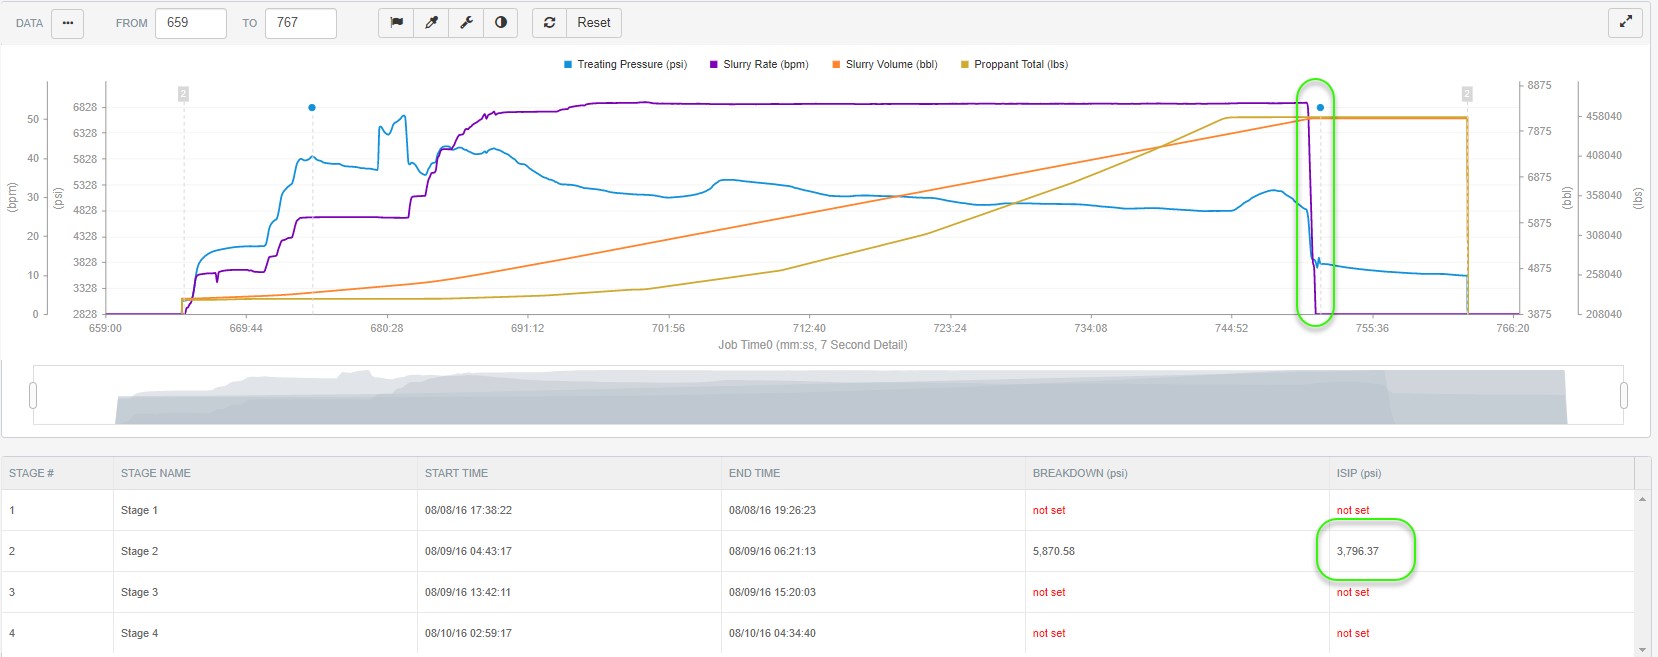
Follow the same steps to set the ISIP pressure.
As a reminder, the pressures can only be set by clicking on the point on the chart where you want them. They cannot be “typed” into the corresponding fields on the grid below the chart.
The ISIP pressure will be indicated by the “blue” dot on the chart. And the value is displayed in the grid below the graph.
You can easily delete these settings by hovering over the value in the grid and selecting the “X” to clear the setting.
Option 2: Manually Enter Override Values on the Treatment Data Page.
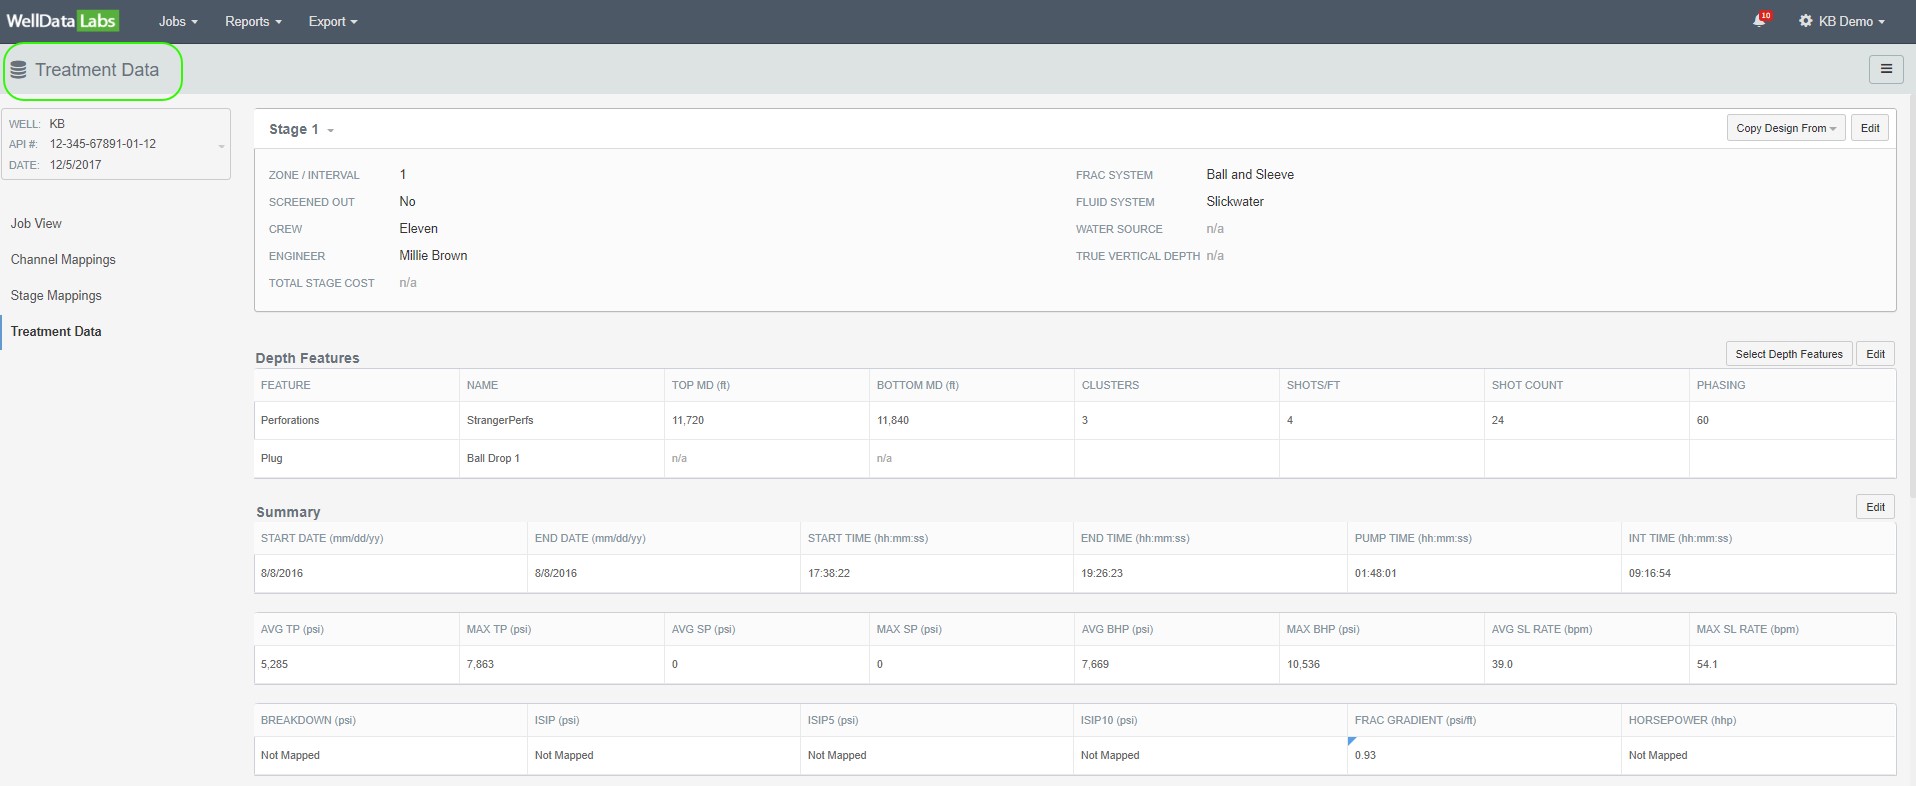
If you prefer to manually enter/override the Breakdown and ISIP pressures, you can do so on the Treatment Data page.
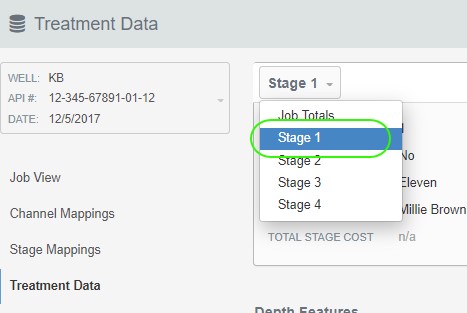
Select the Stage you would like to override by clicking on the Stage drop-down found in the upper left-hand corner of the page.
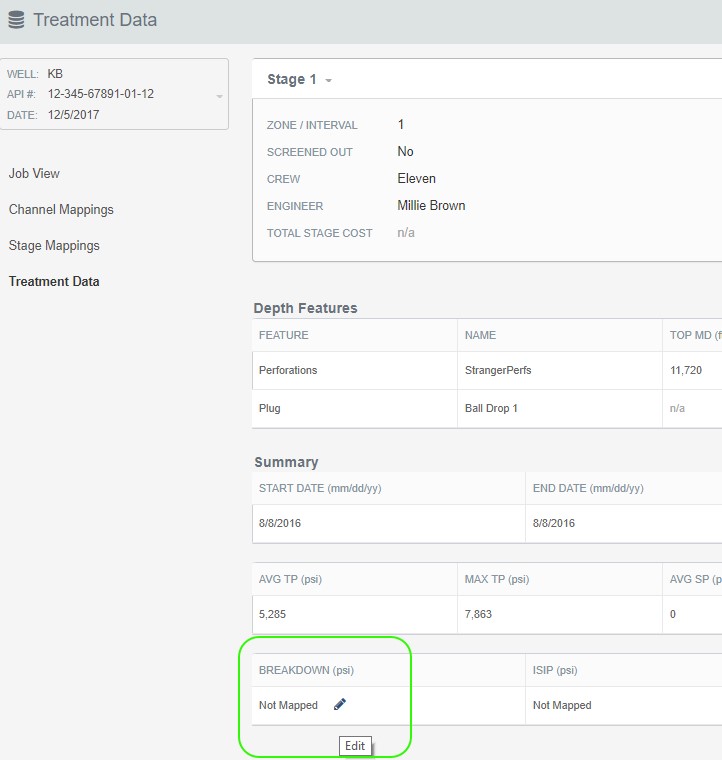
Hover over the Breakdown and/or the ISIP and click the Edit pencil.
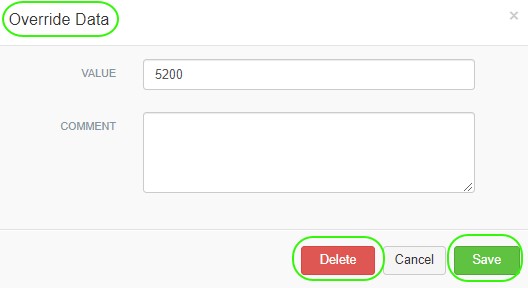
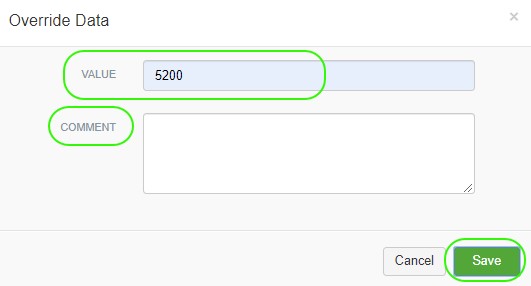
When the Override Data window opens, enter your value and any comments. Click Save.
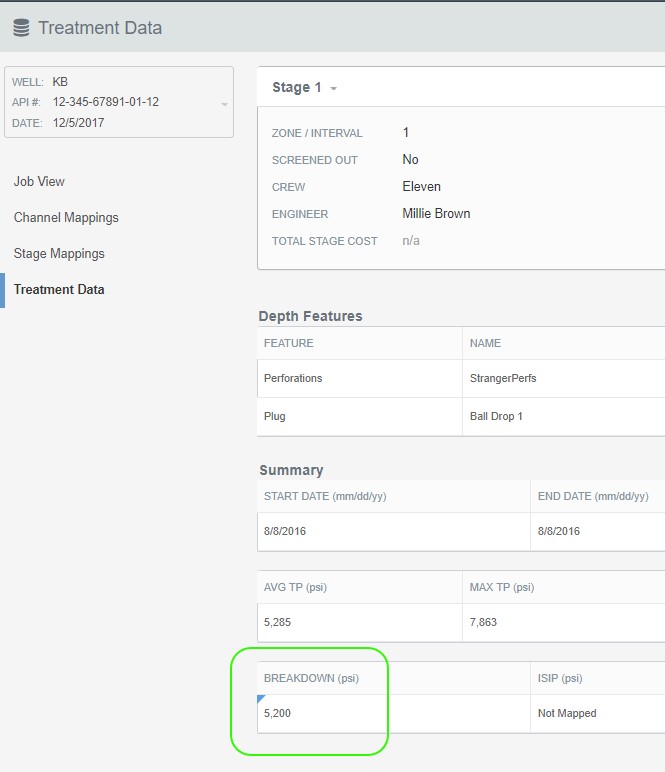
The overwritten data will be indicated by the caret in the upper left-hand corner of the field.
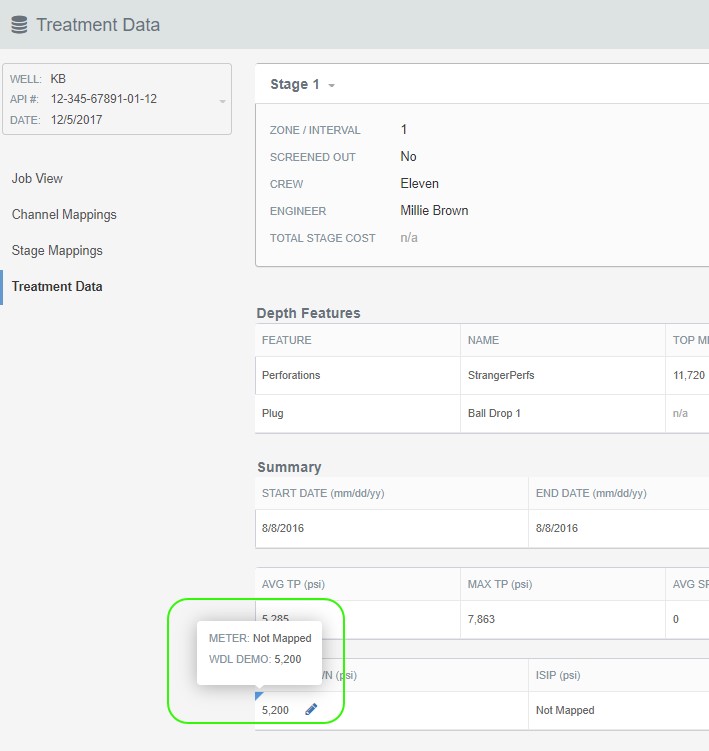
Hovering over the caret will display the overwritten history.
Easily Edit or Delete your overrides by clicking on the Edit pencil.
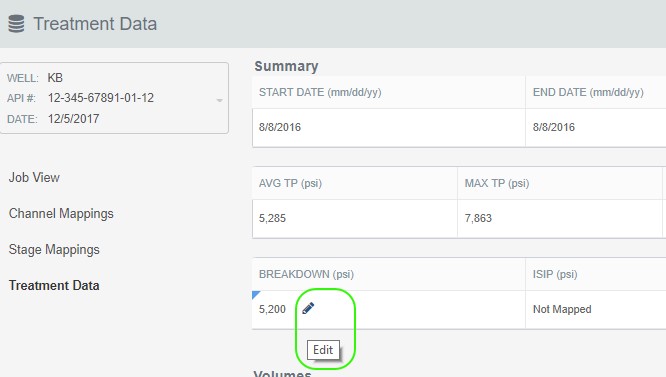
Delete or Save your override.