What can we help you with today?
Get help straight from the team at Well Data Labs...
Reports/Data Analytical Tools
Creating New Chart Templates
Updated 2 weeks ago
If you find yourself selecting the same data elements over and over on any of the available report charts, you can easily create a Chart Template. This eliminates the need to re-select all of those elements each time you need to graph them!
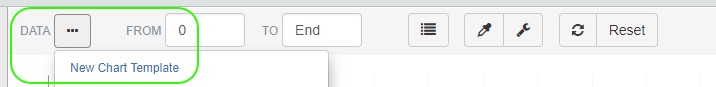
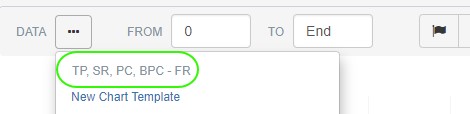
When you are in a report, you will find the Chart Template by clicking on the 3-dot button next to Data on the chart toolbar and selecting New Chart Template.
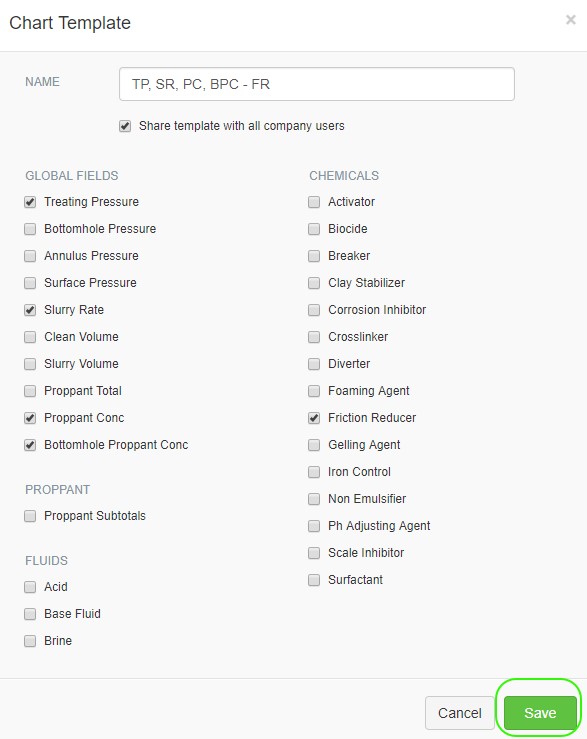
When the template opens, enter a Name for your template, select the “Share template with all company users” box if applicable and select any elements you would like. Click Save when you are finished.
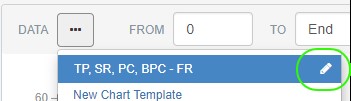
The template has been created and is available to select from the 3-dot button.
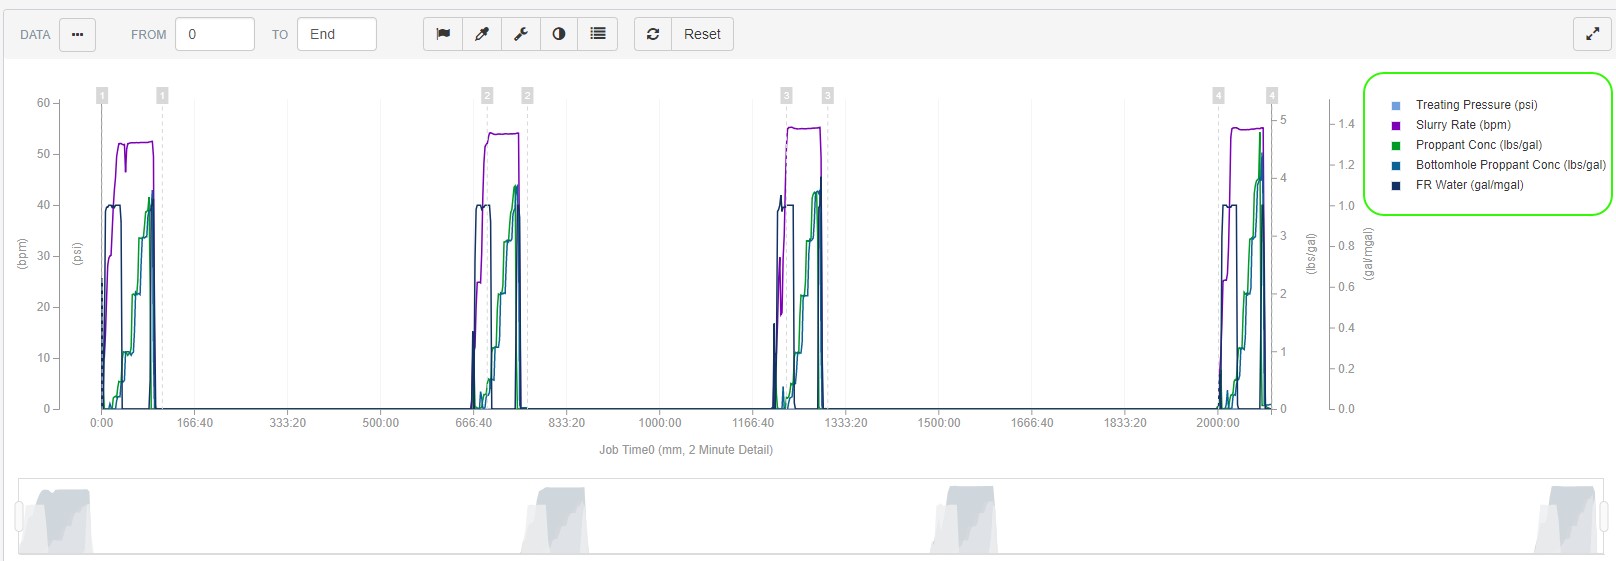
Once selected, the elements in the template are displayed on the chart.
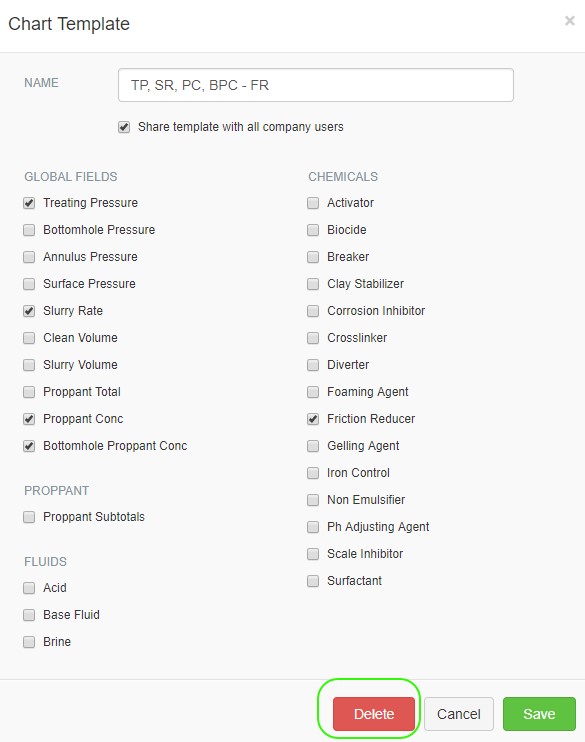
The template can be edited or deleted by clicking on the edit pencil to the right of the template.