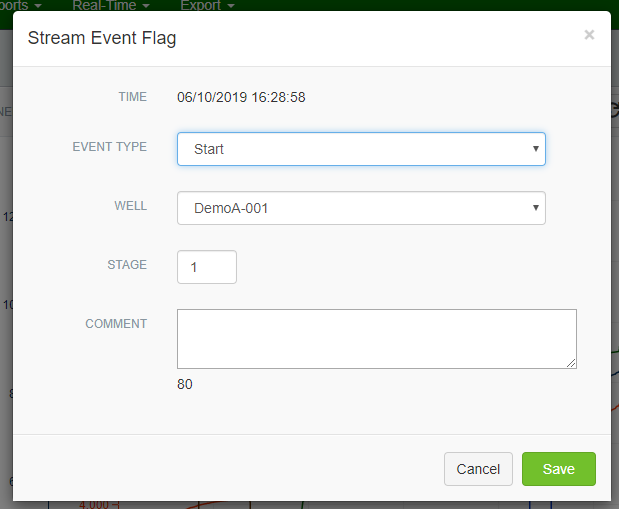
With event flagging, you can mark the Start & End of the Stage, as well as add a comment to visually bring attention to something in your data at a specific moment in time.
To add an event, click the 'Flag' button and then visually select on the chart where you would like to place the event.
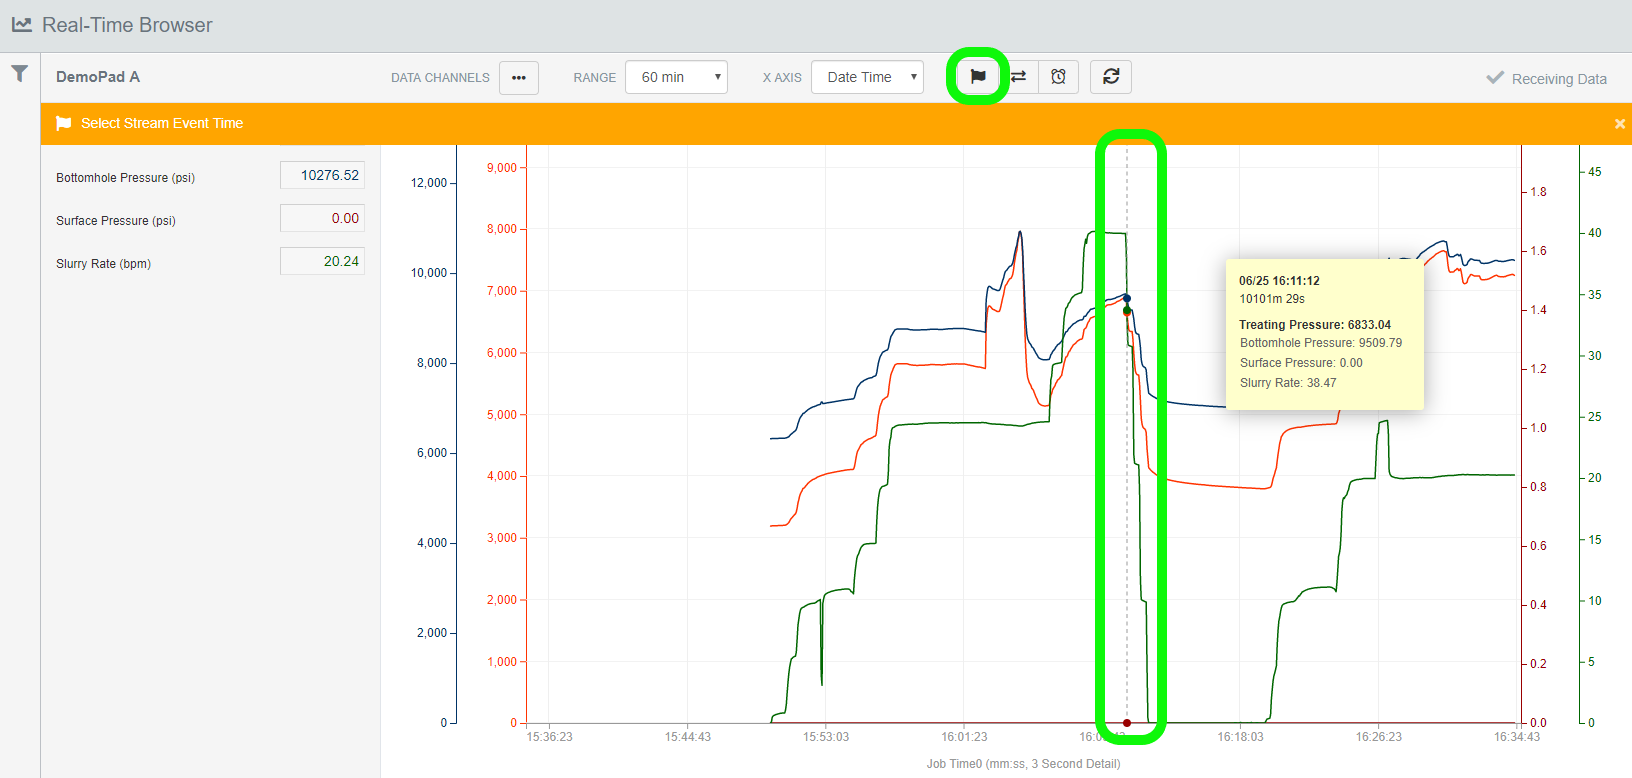
Once you click on the chart where the event is located, the below window will pop-up. You can then select the event type, the associated well, the stage number, and leave an optional comment. Click the green 'Save' button when you're done.